Mapulus Studio - Explore, Enrich, and Export Location Data
Mapulus Studio

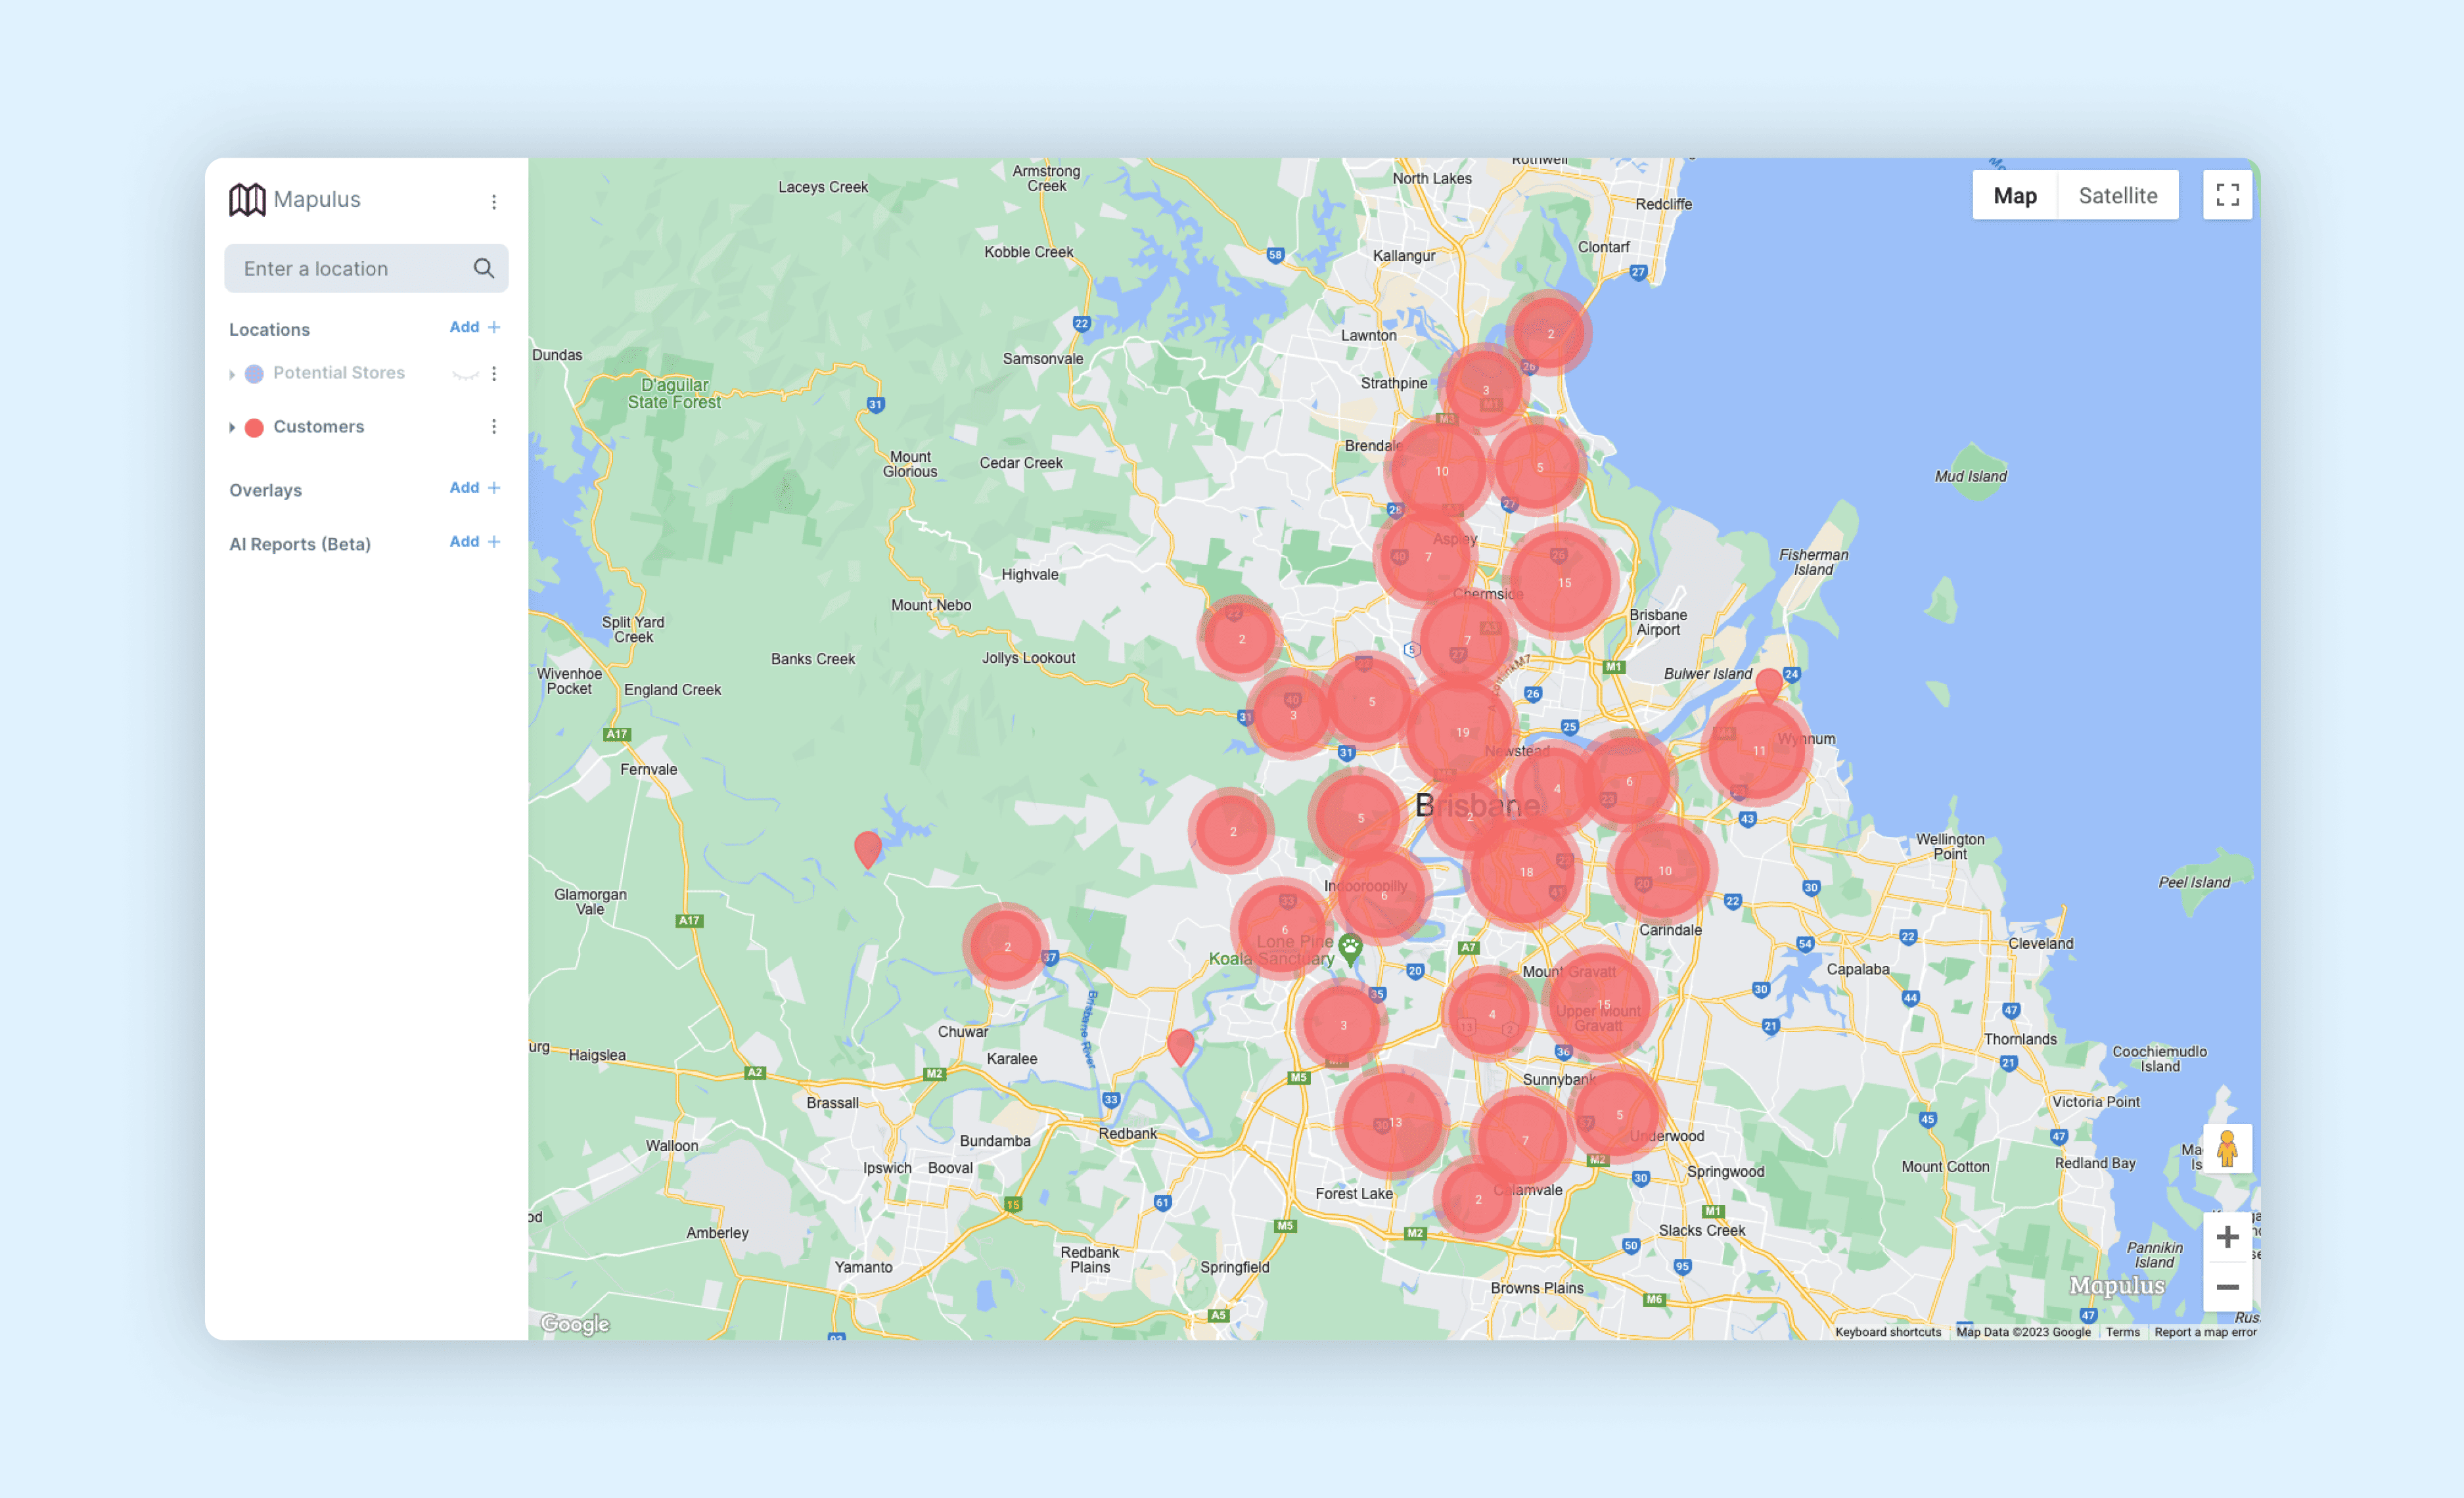
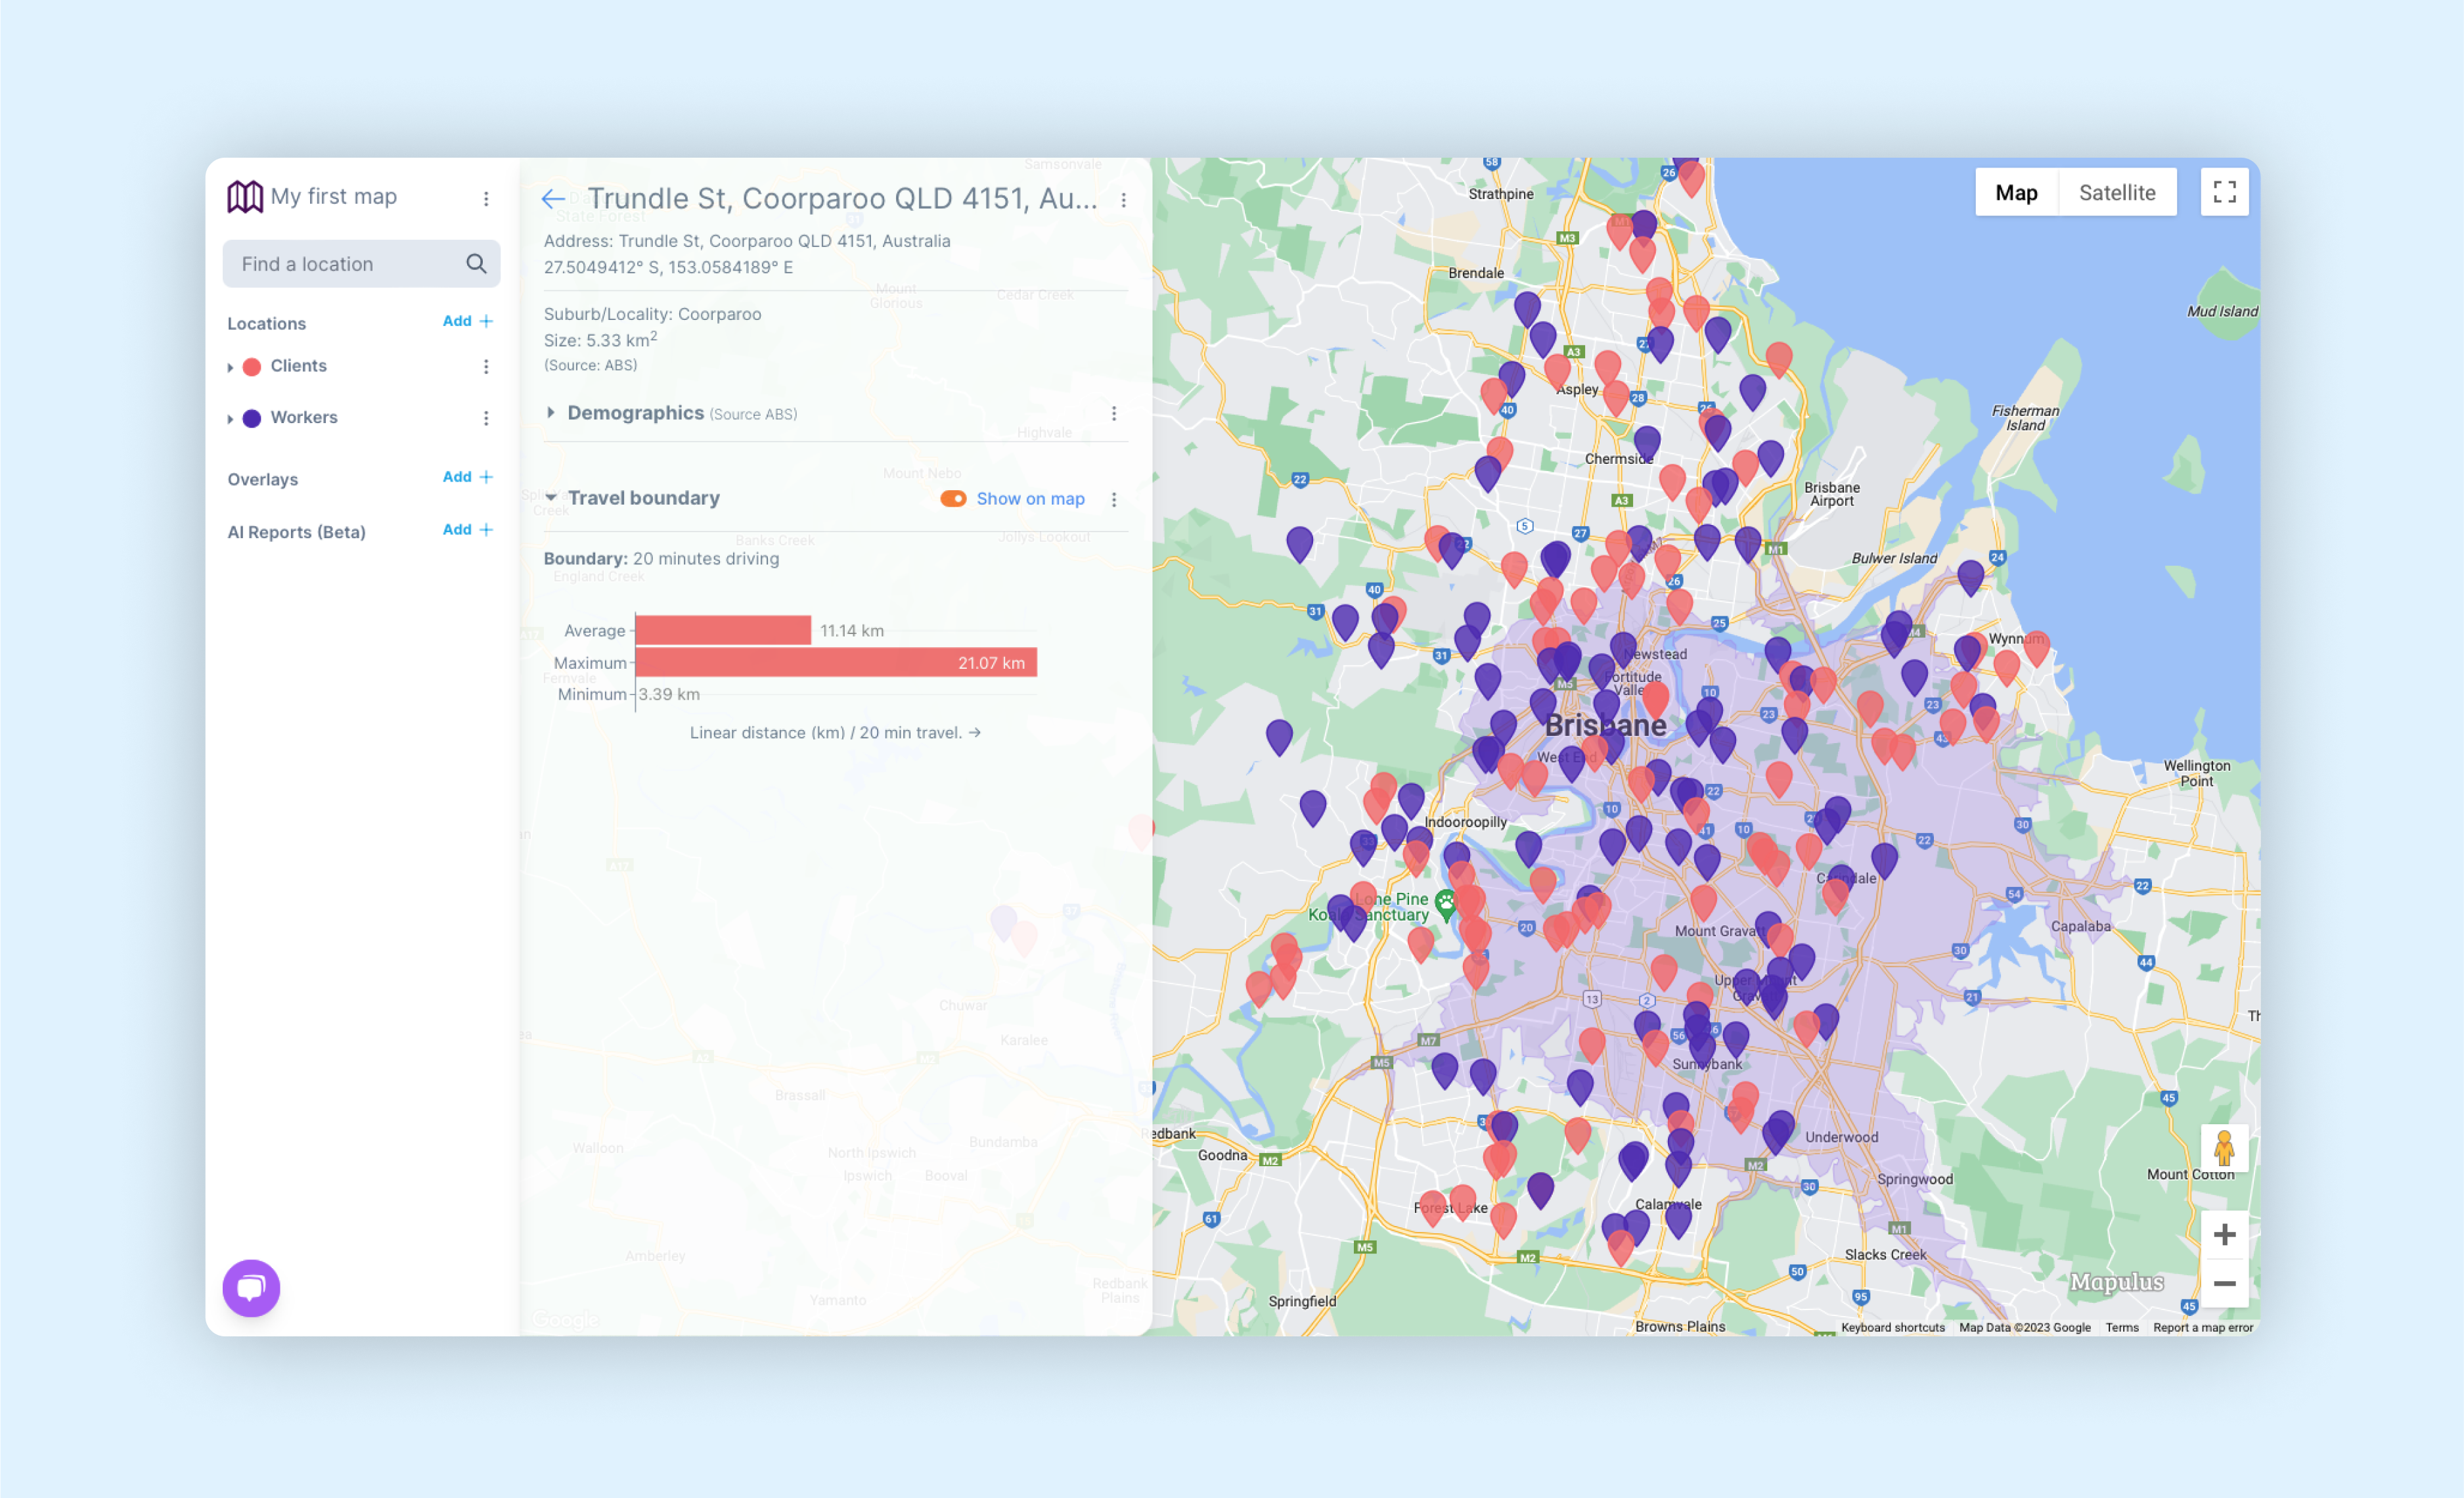
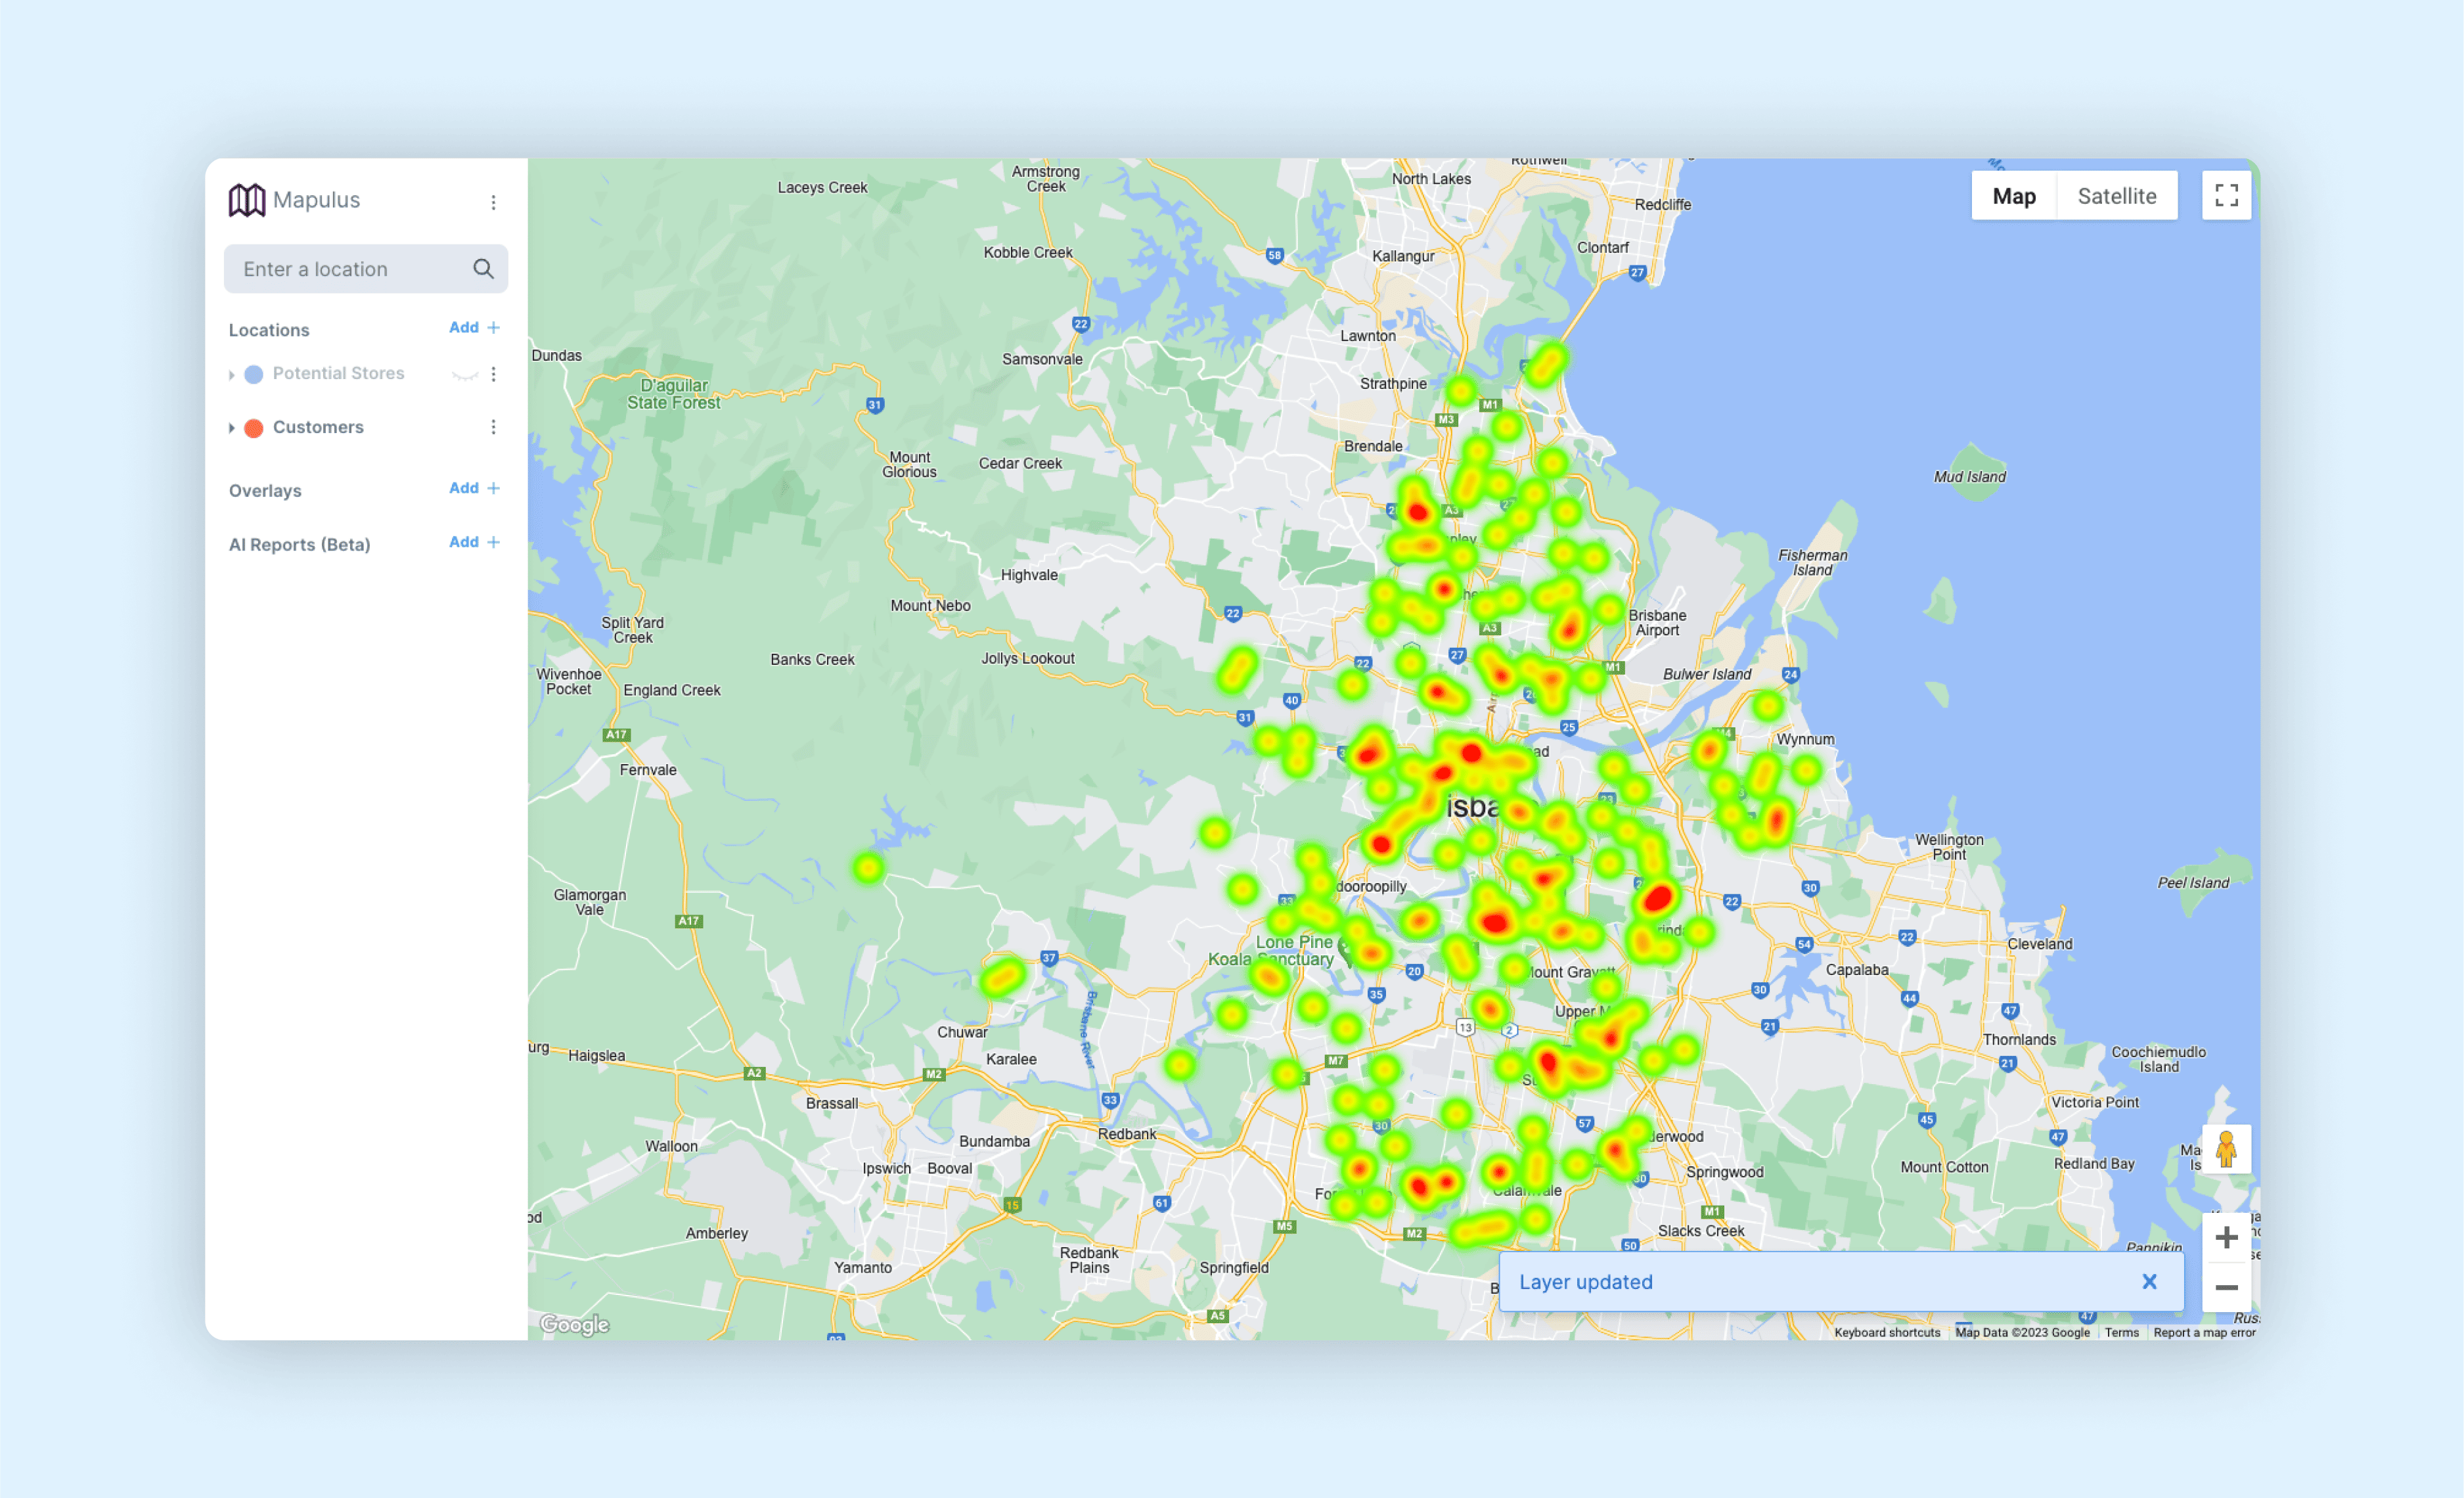
See your locations in context

Import your data. Layer it with Australian movement, events, weather, property, and demographic context. Export enriched datasets ready for analysis.

Mapulus Studio is the visual interface for exploring and enriching location data — without writing code or building pipelines.

Mapulus Studio interface showing location data visualization

Import, explore, enrich, export

A complete workflow for working with location data — from raw addresses to enriched, analysis-ready datasets.

Import

Upload CSV, Excel, or connect via API. Bulk geocode addresses and place your data on the map instantly.

Explore

Visualise your data with heatmaps, clusters, and markers. Filter, search, and drill down to individual locations.

Coming Soon

Enrich

Layer on movement, events, weather, demographics, and property data. Talk to Advisory for early access.

Export

Download your data as CSV. Take the context with you.

Access Australian physical-world data

Explore base data in Studio today. Premium datasets available through Advisory or with a Data Pack subscription.

Demographics

ABS Census data, population projections, income, age profiles

Boundaries & Geographies

SA1-SA4, LGAs, postcodes, suburbs, states, custom territories

Isochrones & Catchments

Drive time, walk time, and transit-based travel boundaries

Geocoding

Address lookup, reverse geocoding, bulk address matching

Premium data add-ons: Movement patterns, events calendars, weather & environment, property signals, and Next-to-List predictions.

See pricing →
Mapulus Studio showing catchment analysis

Use Studio anywhere in the world

Mapulus Studio works for locations globally. While our richest data coverage is in Australia, core mapping features are available worldwide.

Available globally

  • • Geocoding & address lookup
  • • Isochrones (travel time boundaries)
  • • Your own location data
  • • Map sharing & embedding
  • • CSV exports

Australia only (for now)

  • • Demographics & census data
  • • Statistical boundaries (SA1-SA4)
  • • Property & planning data
  • • Movement & events data
  • • Premium data packs

We're expanding data coverage to additional countries. Contact us if you have specific international requirements.

Multiple ways to visualise

Switch between views to understand patterns, density, and distribution across your locations.

Marker view

Markers & Pins

Individual location markers with custom icons, colours, and popup details.

Heatmap view

Heatmaps

Density visualisation showing concentration and activity hotspots.

Cluster view

Boundaries & Territories

Overlay official boundaries or create custom territories and catchments.

Built for teams working with location data

Team collaboration

Share maps with colleagues. Control who can view and who can edit.

Bulk operations

Upload thousands of locations. Enrich in bulk. Export everything at once.

API access

Programmatic access to core Studio features. Integrate with your existing systems.

CSV export

Download your enriched data as CSV files.

Secure & private

Your data stays yours. EU-hosted. Enterprise security standards.

Real-time updates

Data refreshes automatically. Always see the latest context.