Coming Soon: Demographics Profiler
Get early access to comprehensive demographic insights
Deep Demographic Insights for Every Australian Location
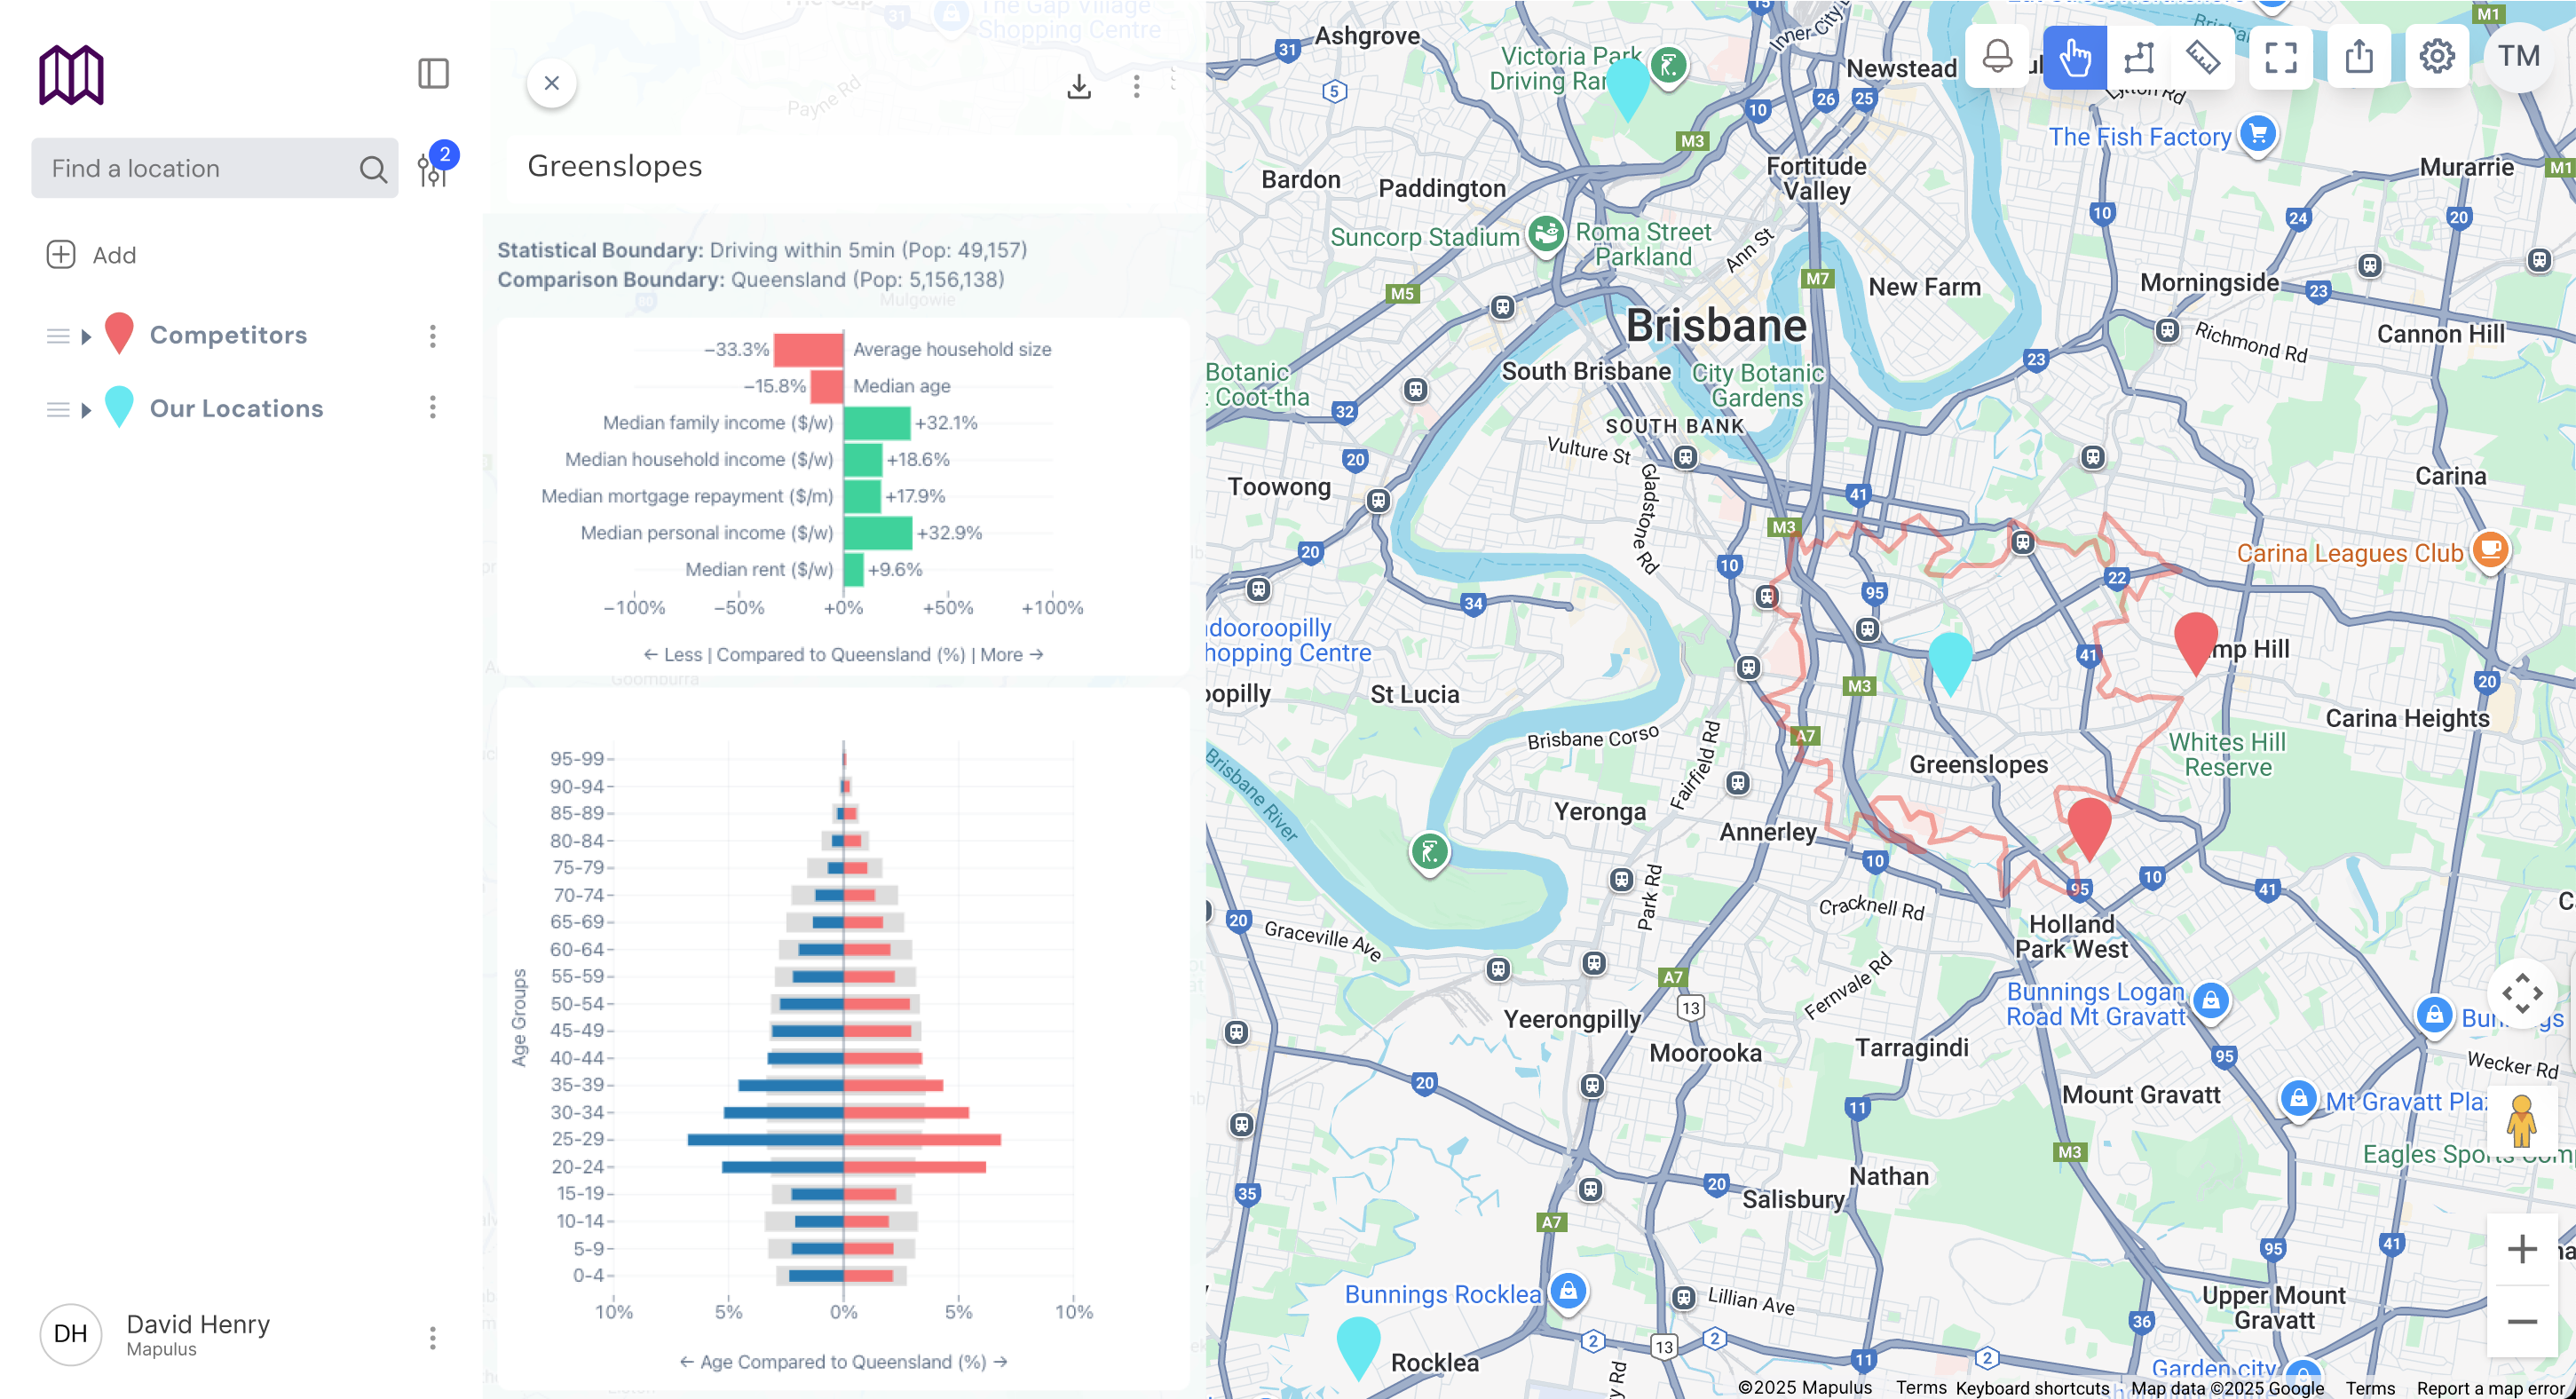
Access comprehensive demographic data for any boundary in Australia - from national level down to SA1 statistical areas. Analyze population characteristics, income levels, age distributions, employment patterns, housing data, and more to make informed business decisions.
Choose any Australian geographic boundary - suburb, postcode, LGA, SA4, SA3, SA2, or even granular SA1 level.
Select from 100+ demographic variables including population, age, income, employment, education, housing, and more.
Get instant demographic profiles with visualizations, comparisons, and exportable reports for your analysis.
From broad national insights to hyper-local SA1 analysis, access demographic data at the exact geographic level you need for your business decisions.
Total population, age distributions, median age, dependency ratios, population growth rates.
Household income, personal income, income distributions, wealth indicators, mortgage stress.
Occupation types, industry sectors, unemployment rates, workforce participation, commute patterns.
Dwelling types, tenure, household composition, family structures, housing costs.
Highest qualification achieved, field of study, school attendance, university enrollment rates.
Country of birth, languages spoken, ancestry, indigenous population, recent arrivals.
Vehicle ownership, commute methods, travel times, public transport usage patterns.
Internet access types, broadband availability, digital device ownership rates.
Disability rates, need for assistance, unpaid care provision, health service usage.
Business counts, industry concentrations, economic output, growth indicators.
Data is sourced from the latest Australian Bureau of Statistics census and updated with quarterly estimates where available.
SA1 (Statistical Area Level 1) is the smallest geographic unit with typically 200-800 people, providing the most granular demographic insights.
Yes, compare up to 10 boundaries side-by-side and benchmark against state or national averages.
Yes, export demographic profiles as PDF reports or CSV/Excel files for further analysis and presentations.
Yes, access census data from 2011, 2016, and 2021 to analyze demographic trends and changes over time.
Yes, draw custom boundaries or create radius-based catchments to aggregate demographic data for specific areas.