Transform location data into clear, interactive visual maps and insights. See the unseen, understand your market, pinpoint the opportunity, and confidently make your next move.
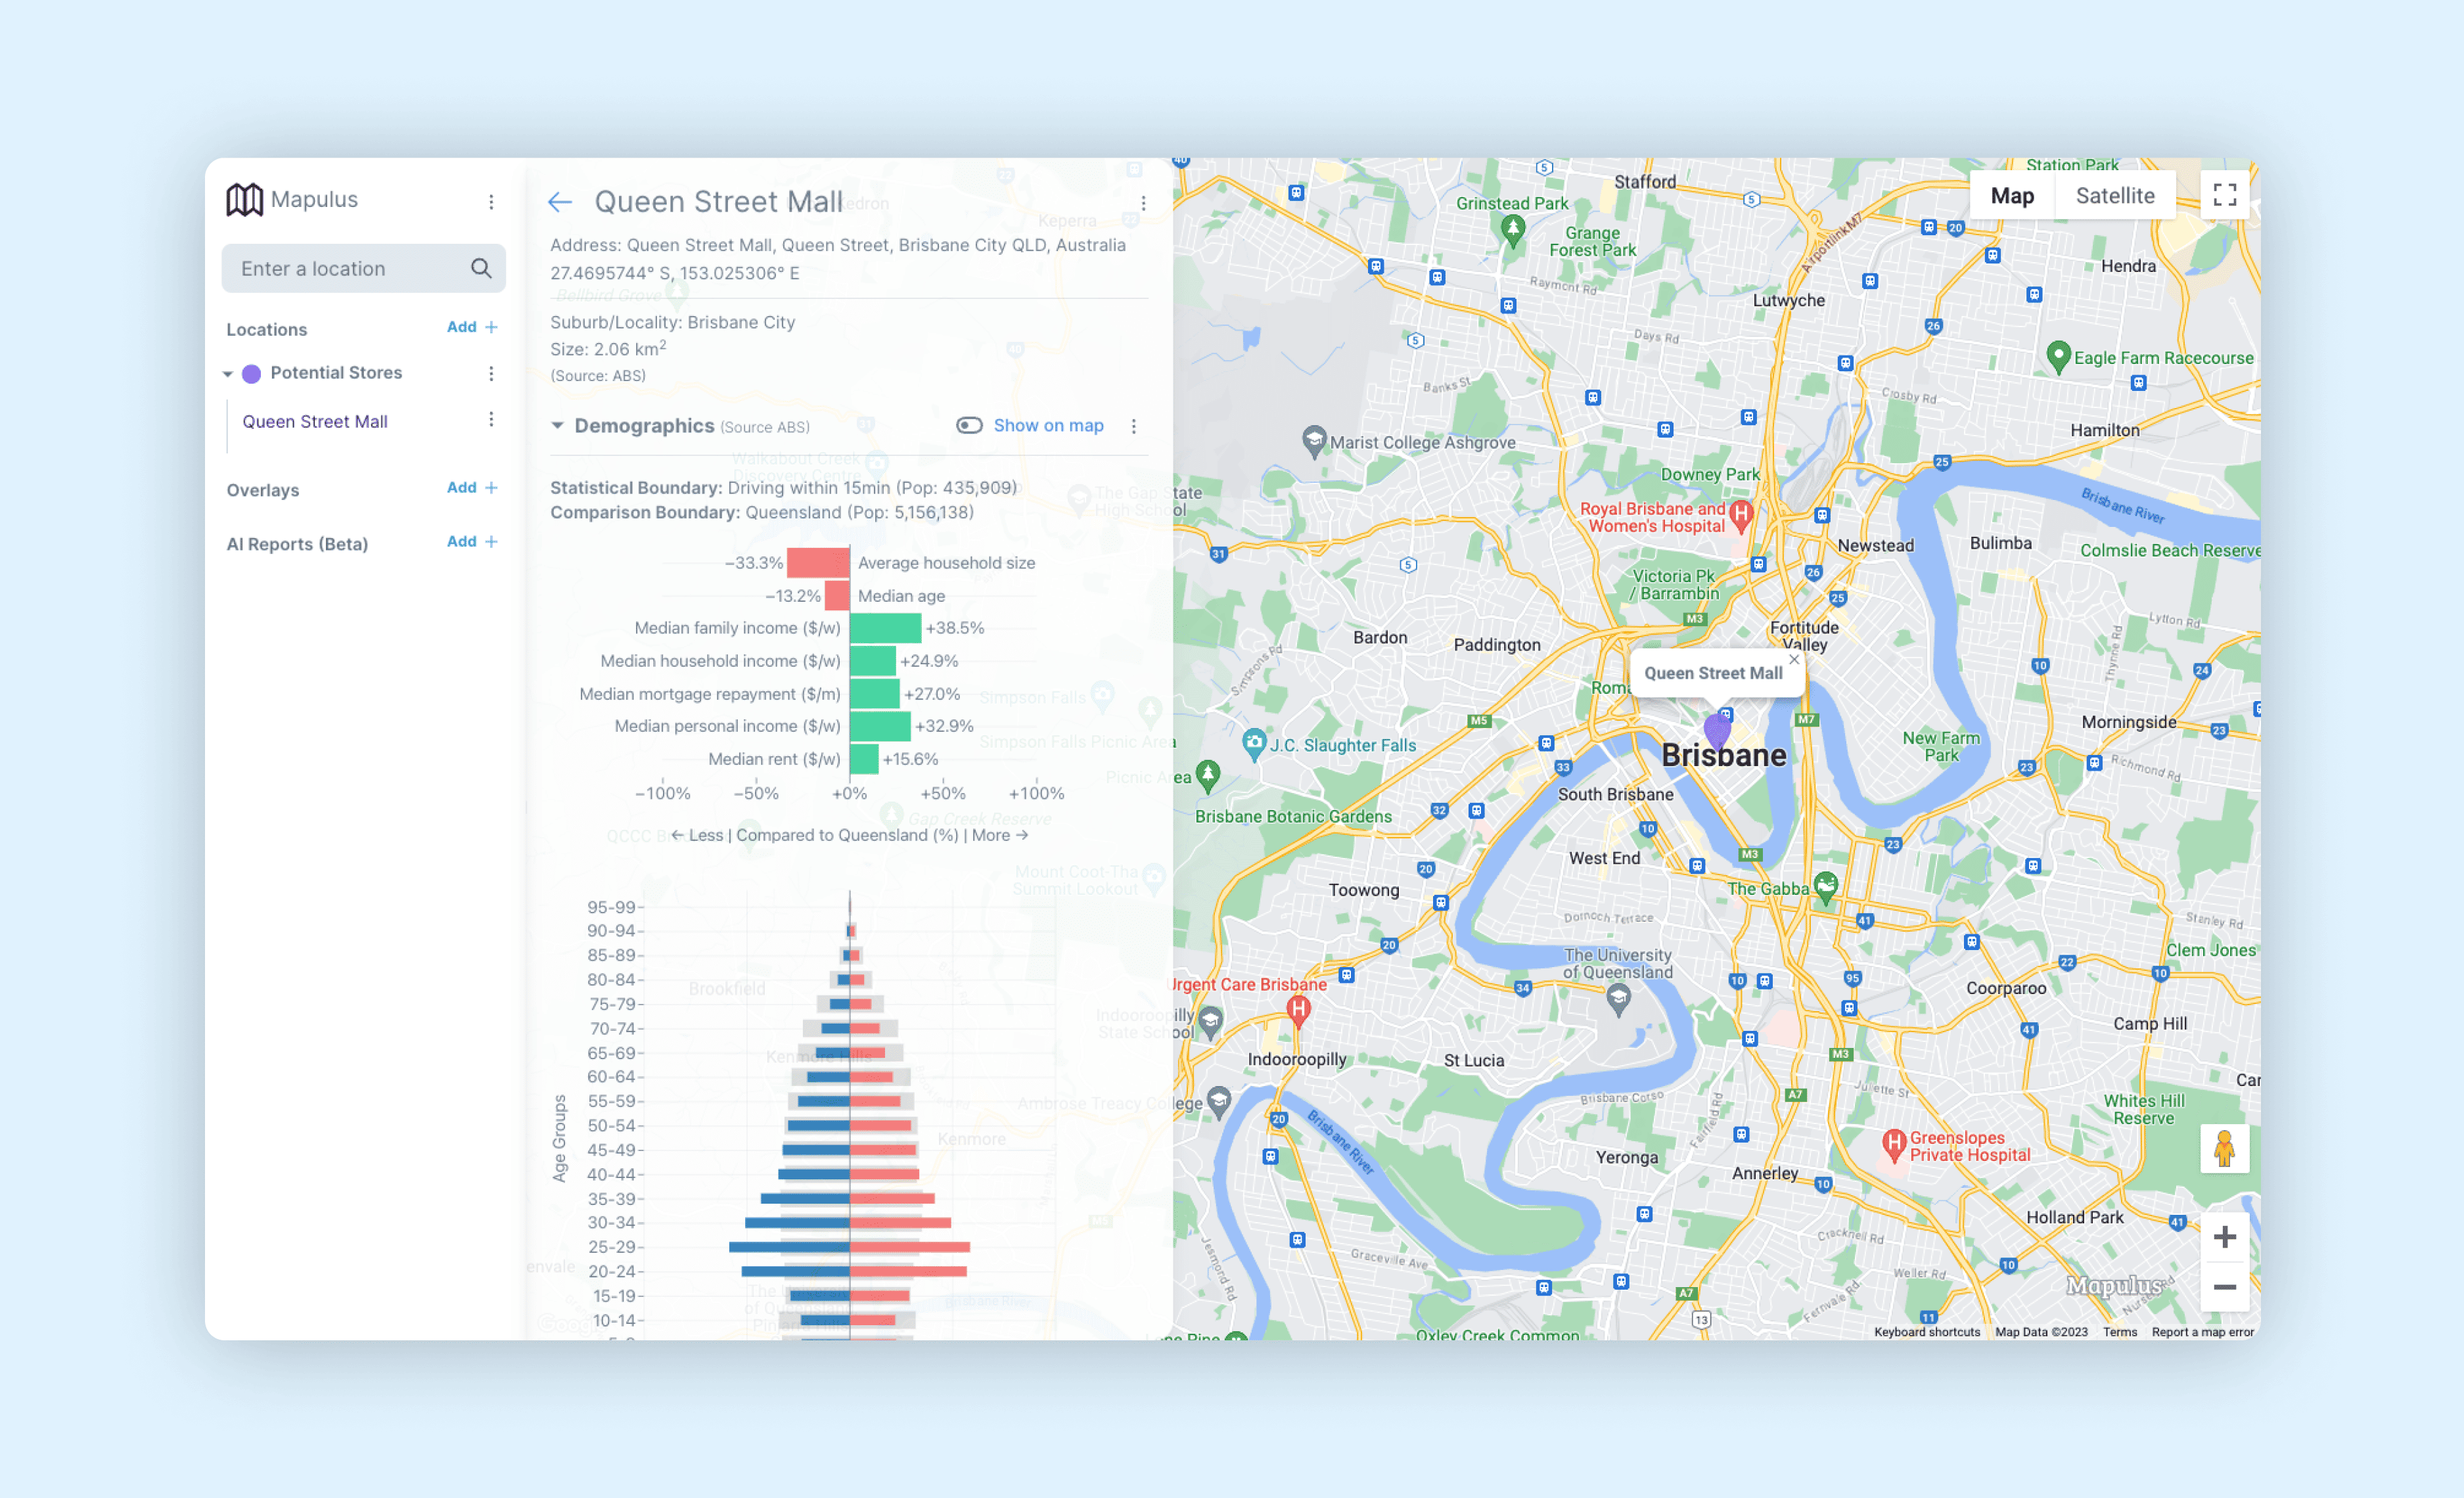
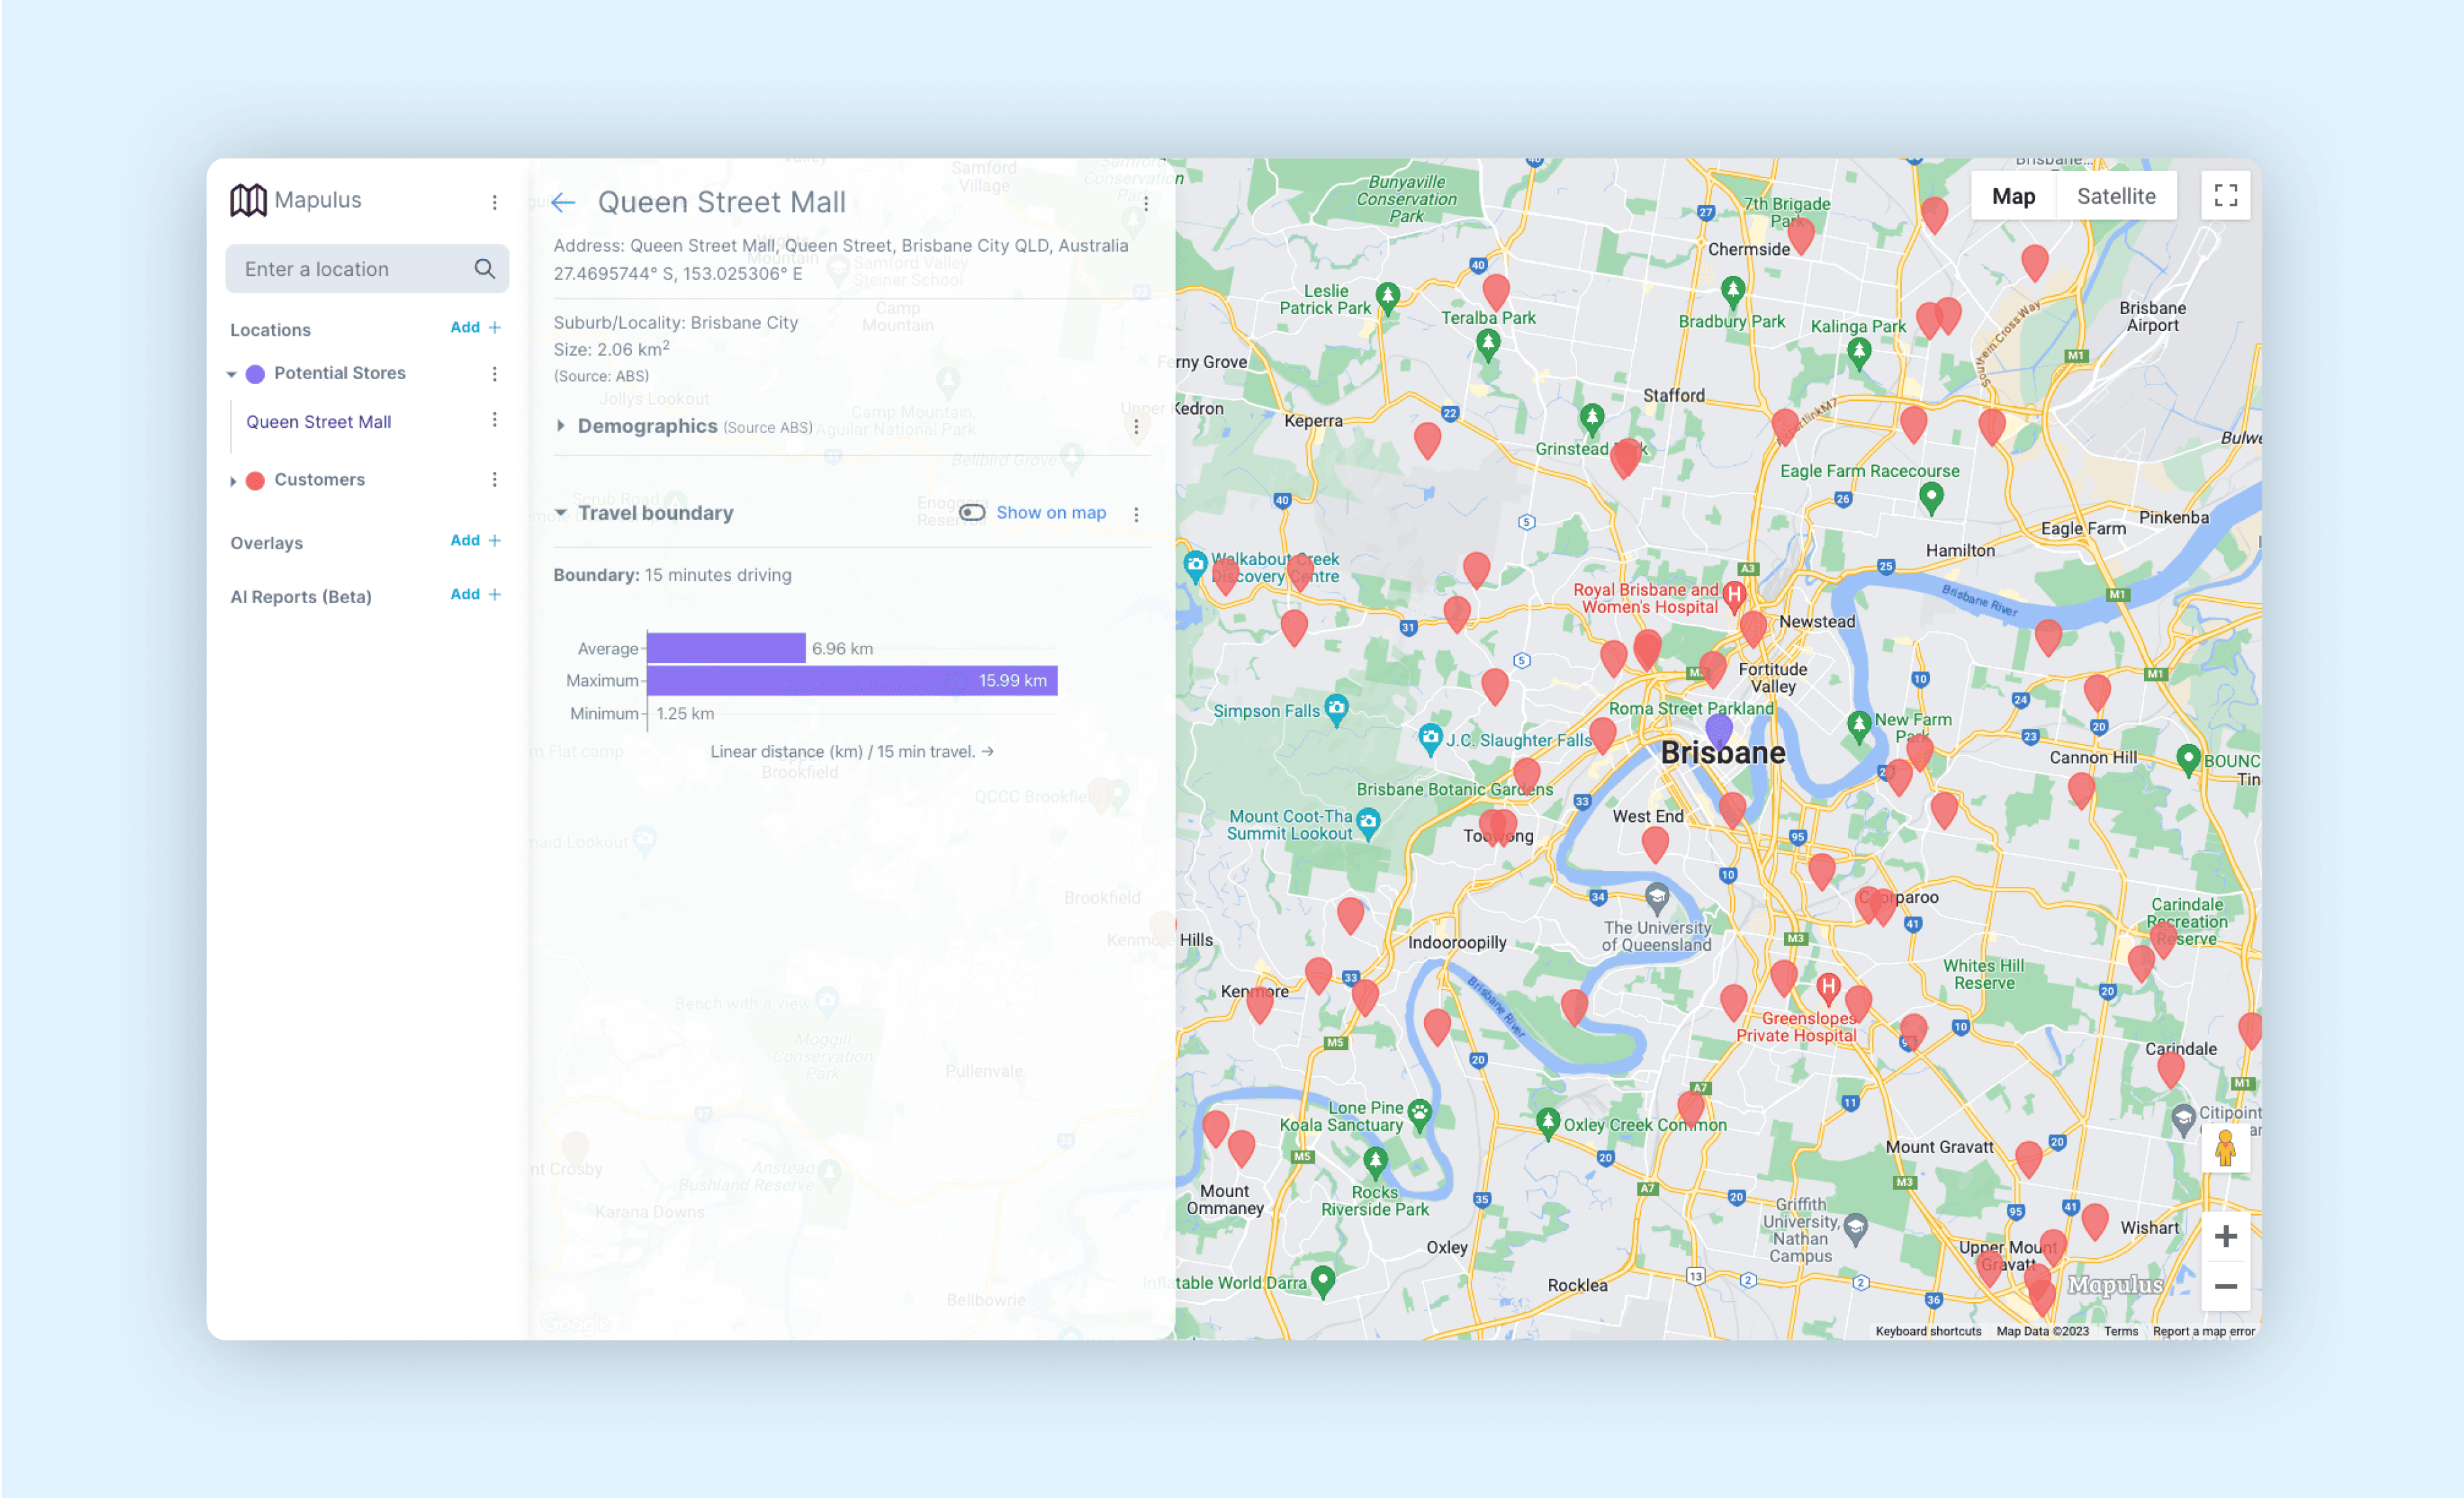
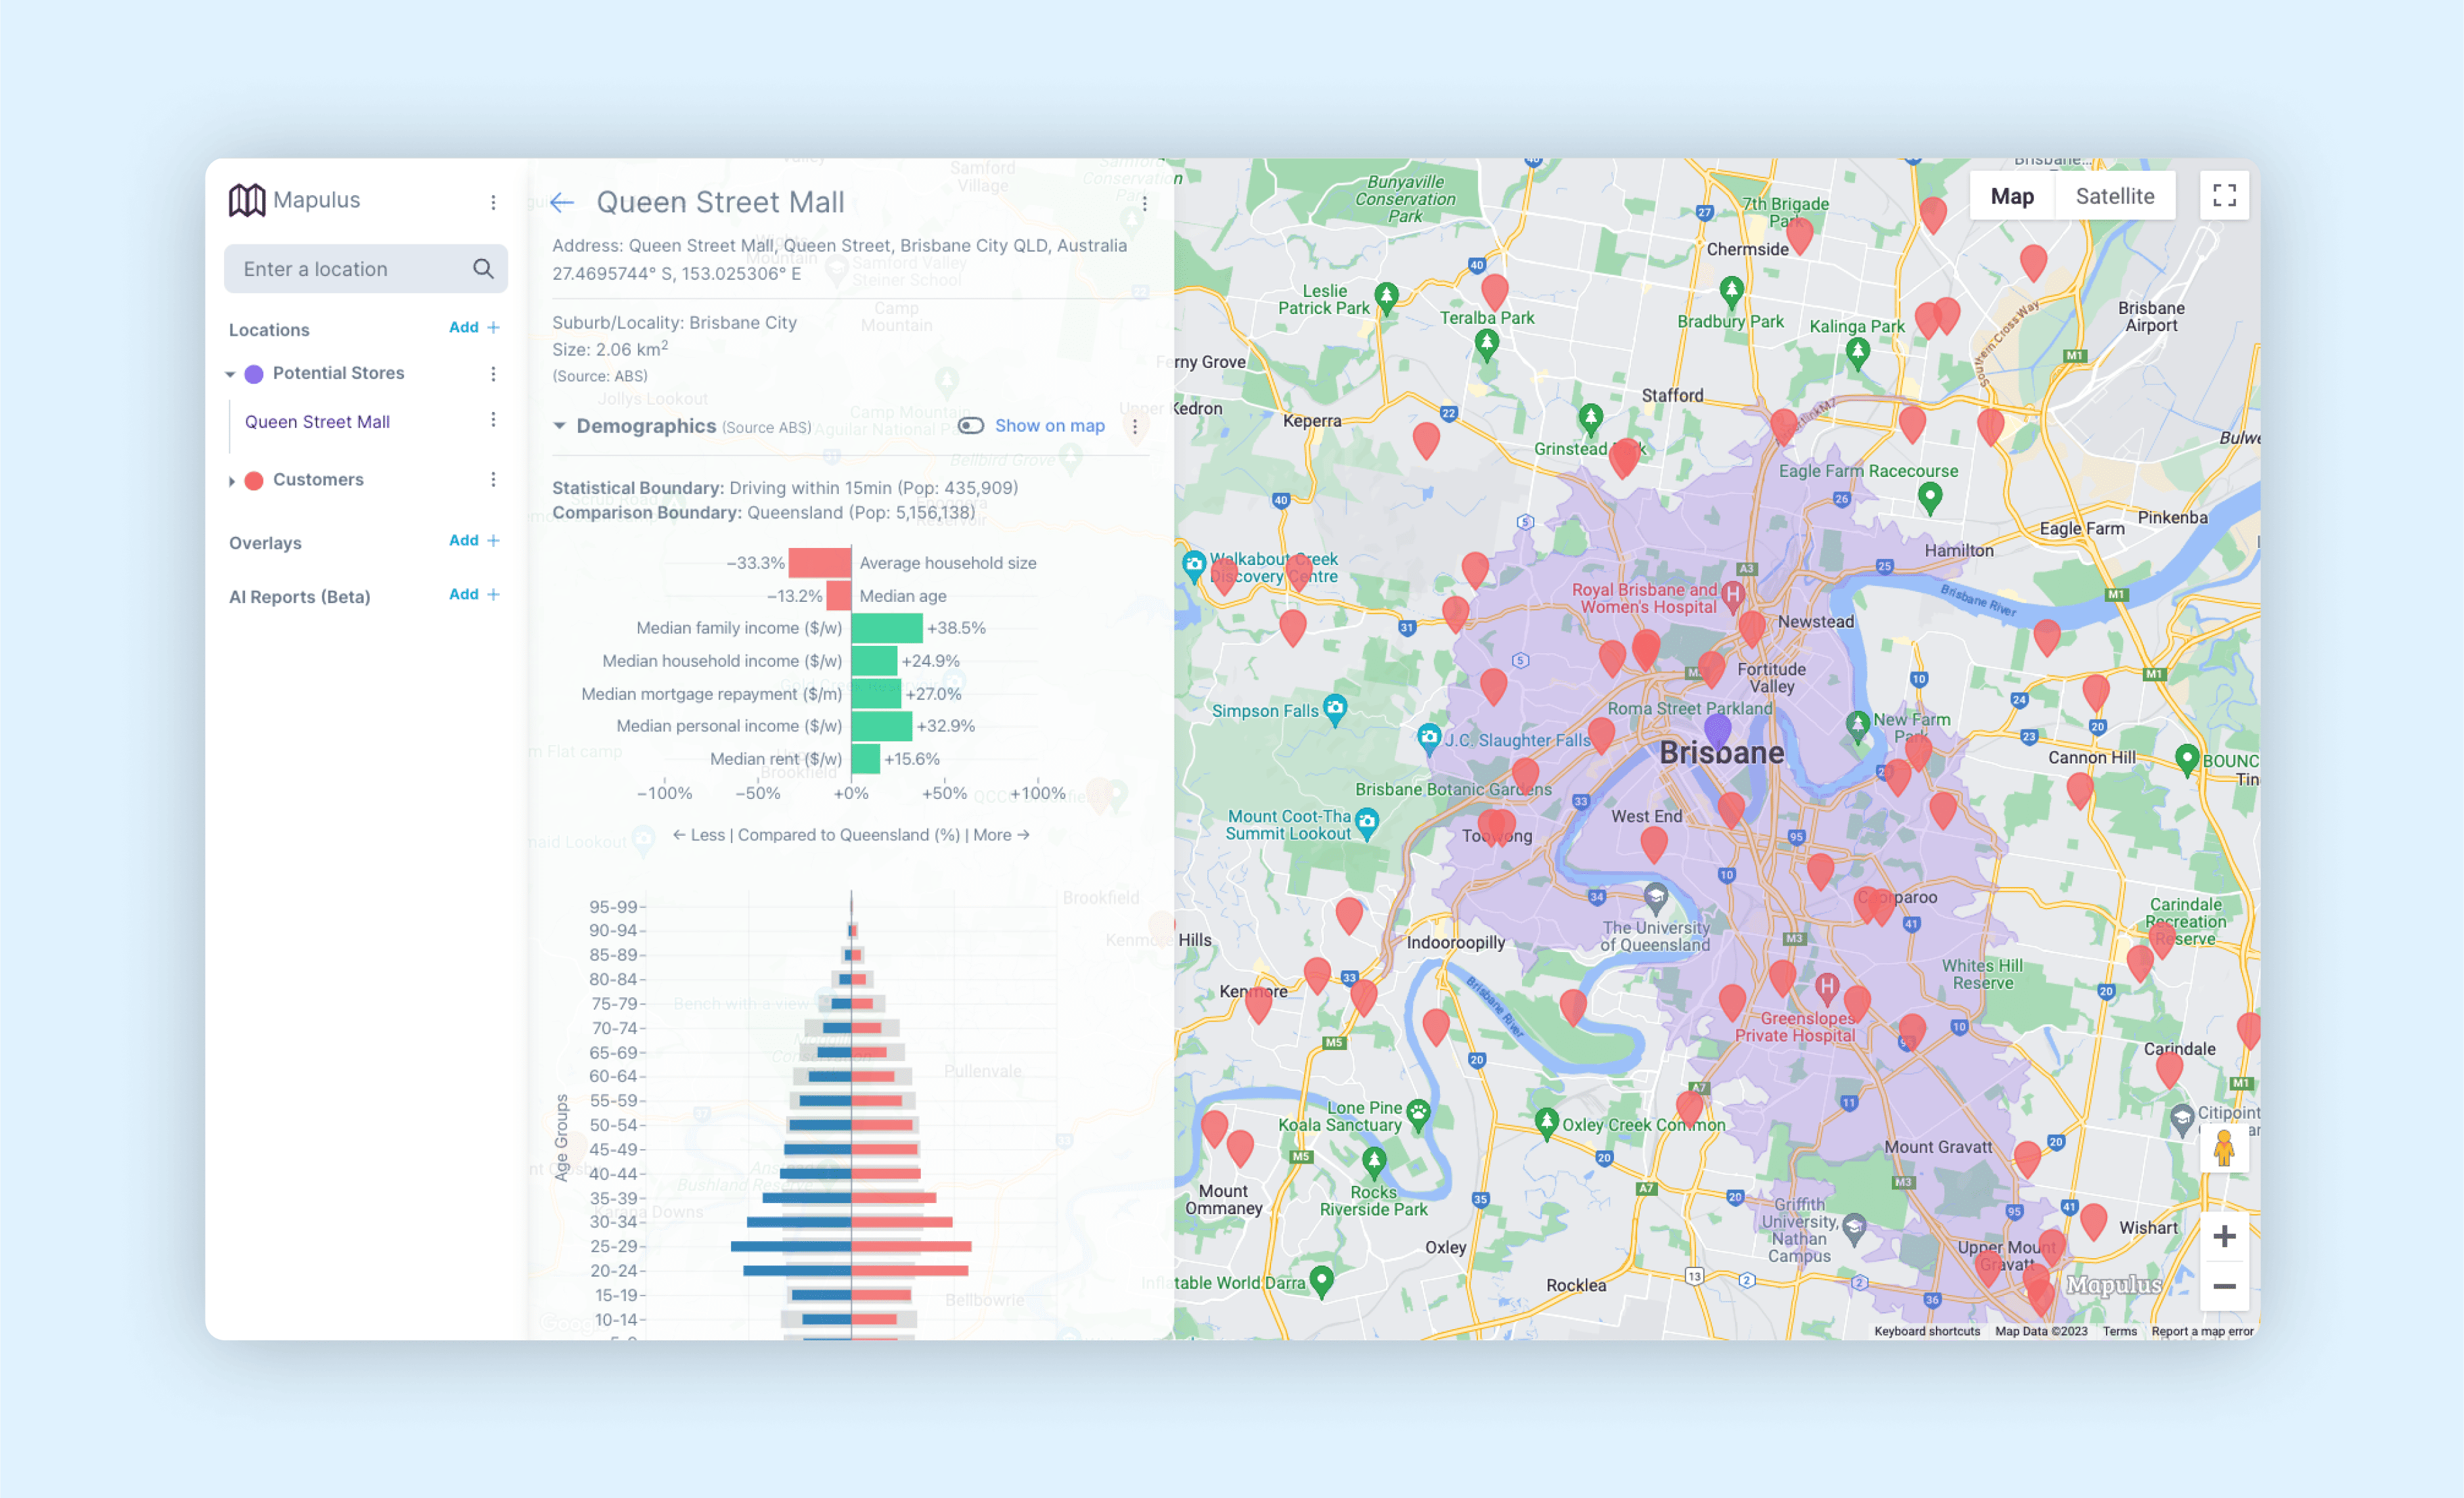
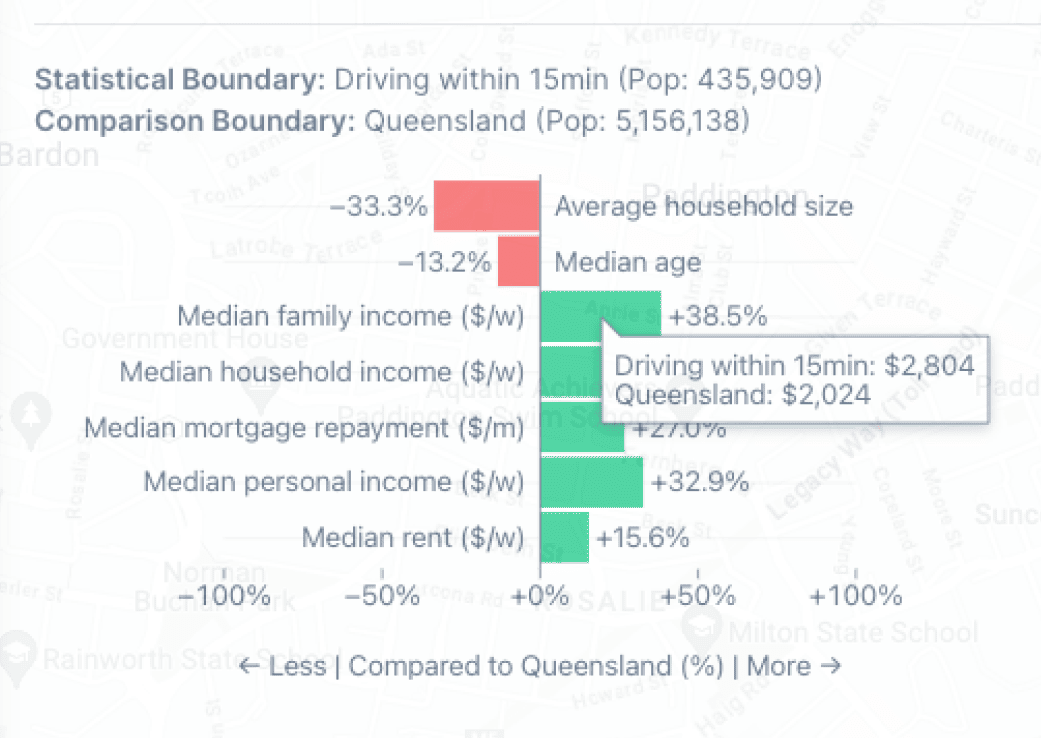
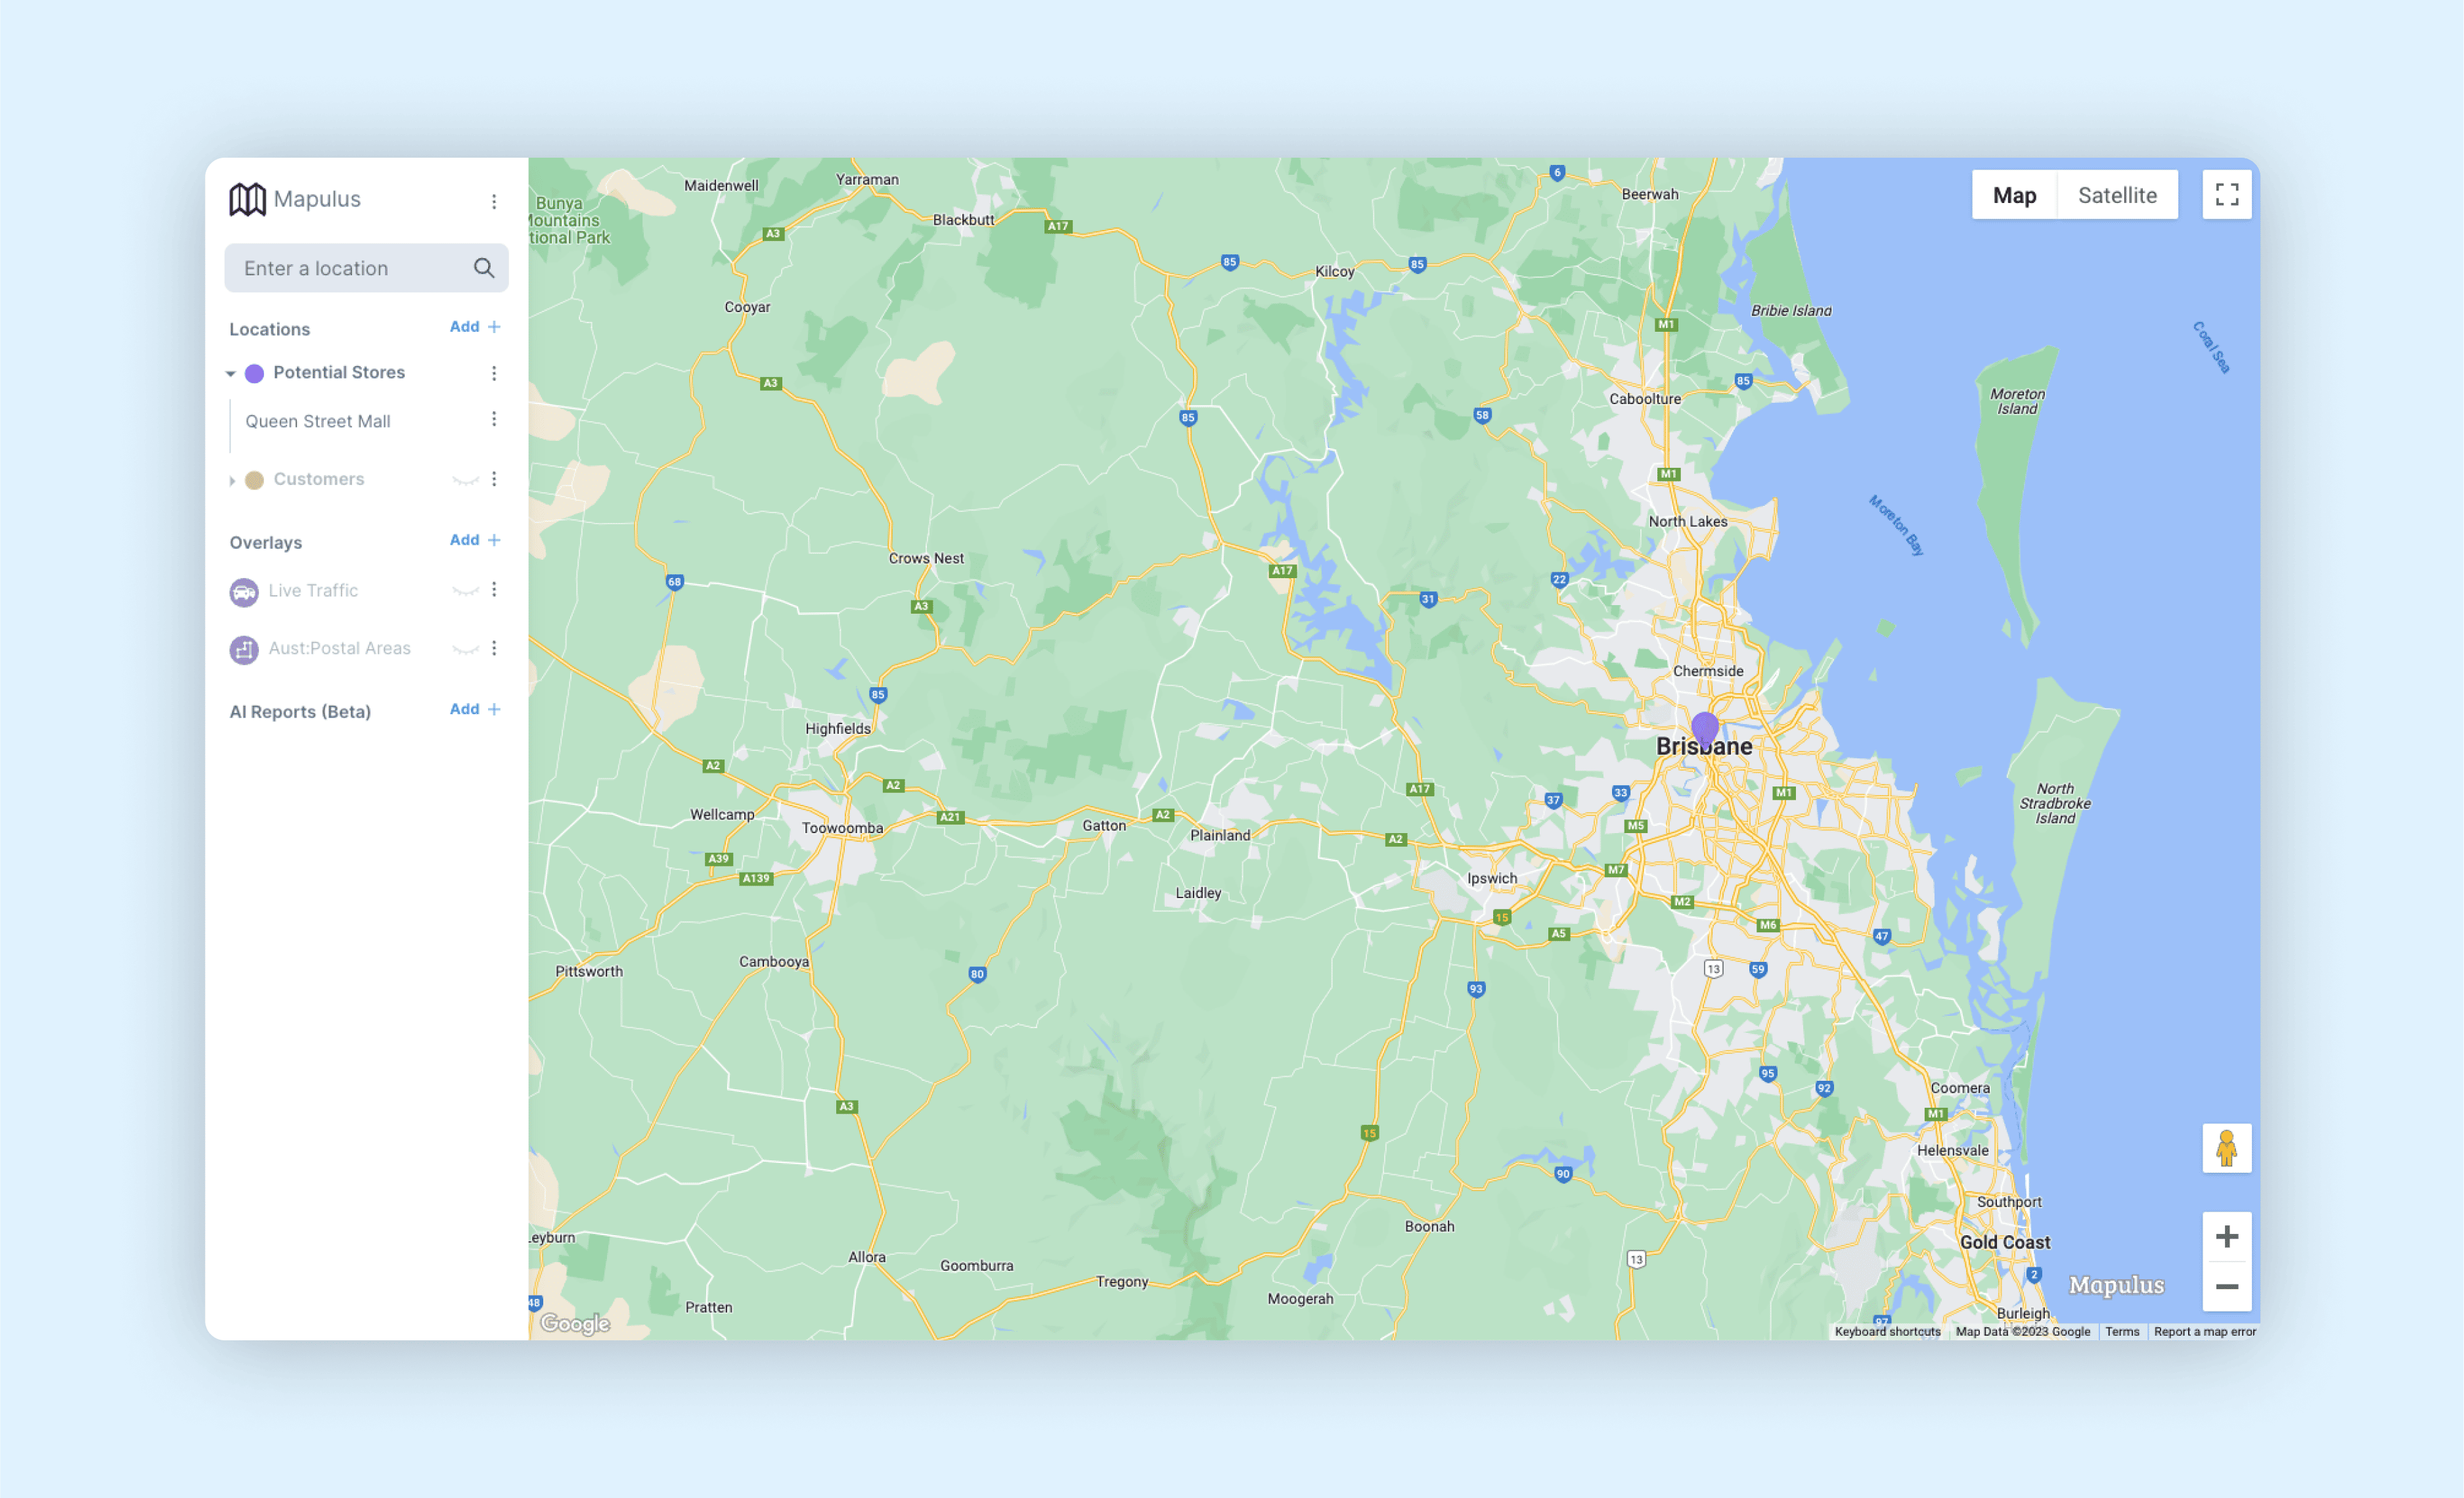
Harness the power of location intelligence to make informed decisions about where your business should be situated. Delve into an area’s demographic composition (AU only) to strategically position your business. Craft effective marketing and sales strategies by comparing, contrasting, and enriching insights from multiple locations on a map. Recognise the untapped potential of a place and position your investment for success.
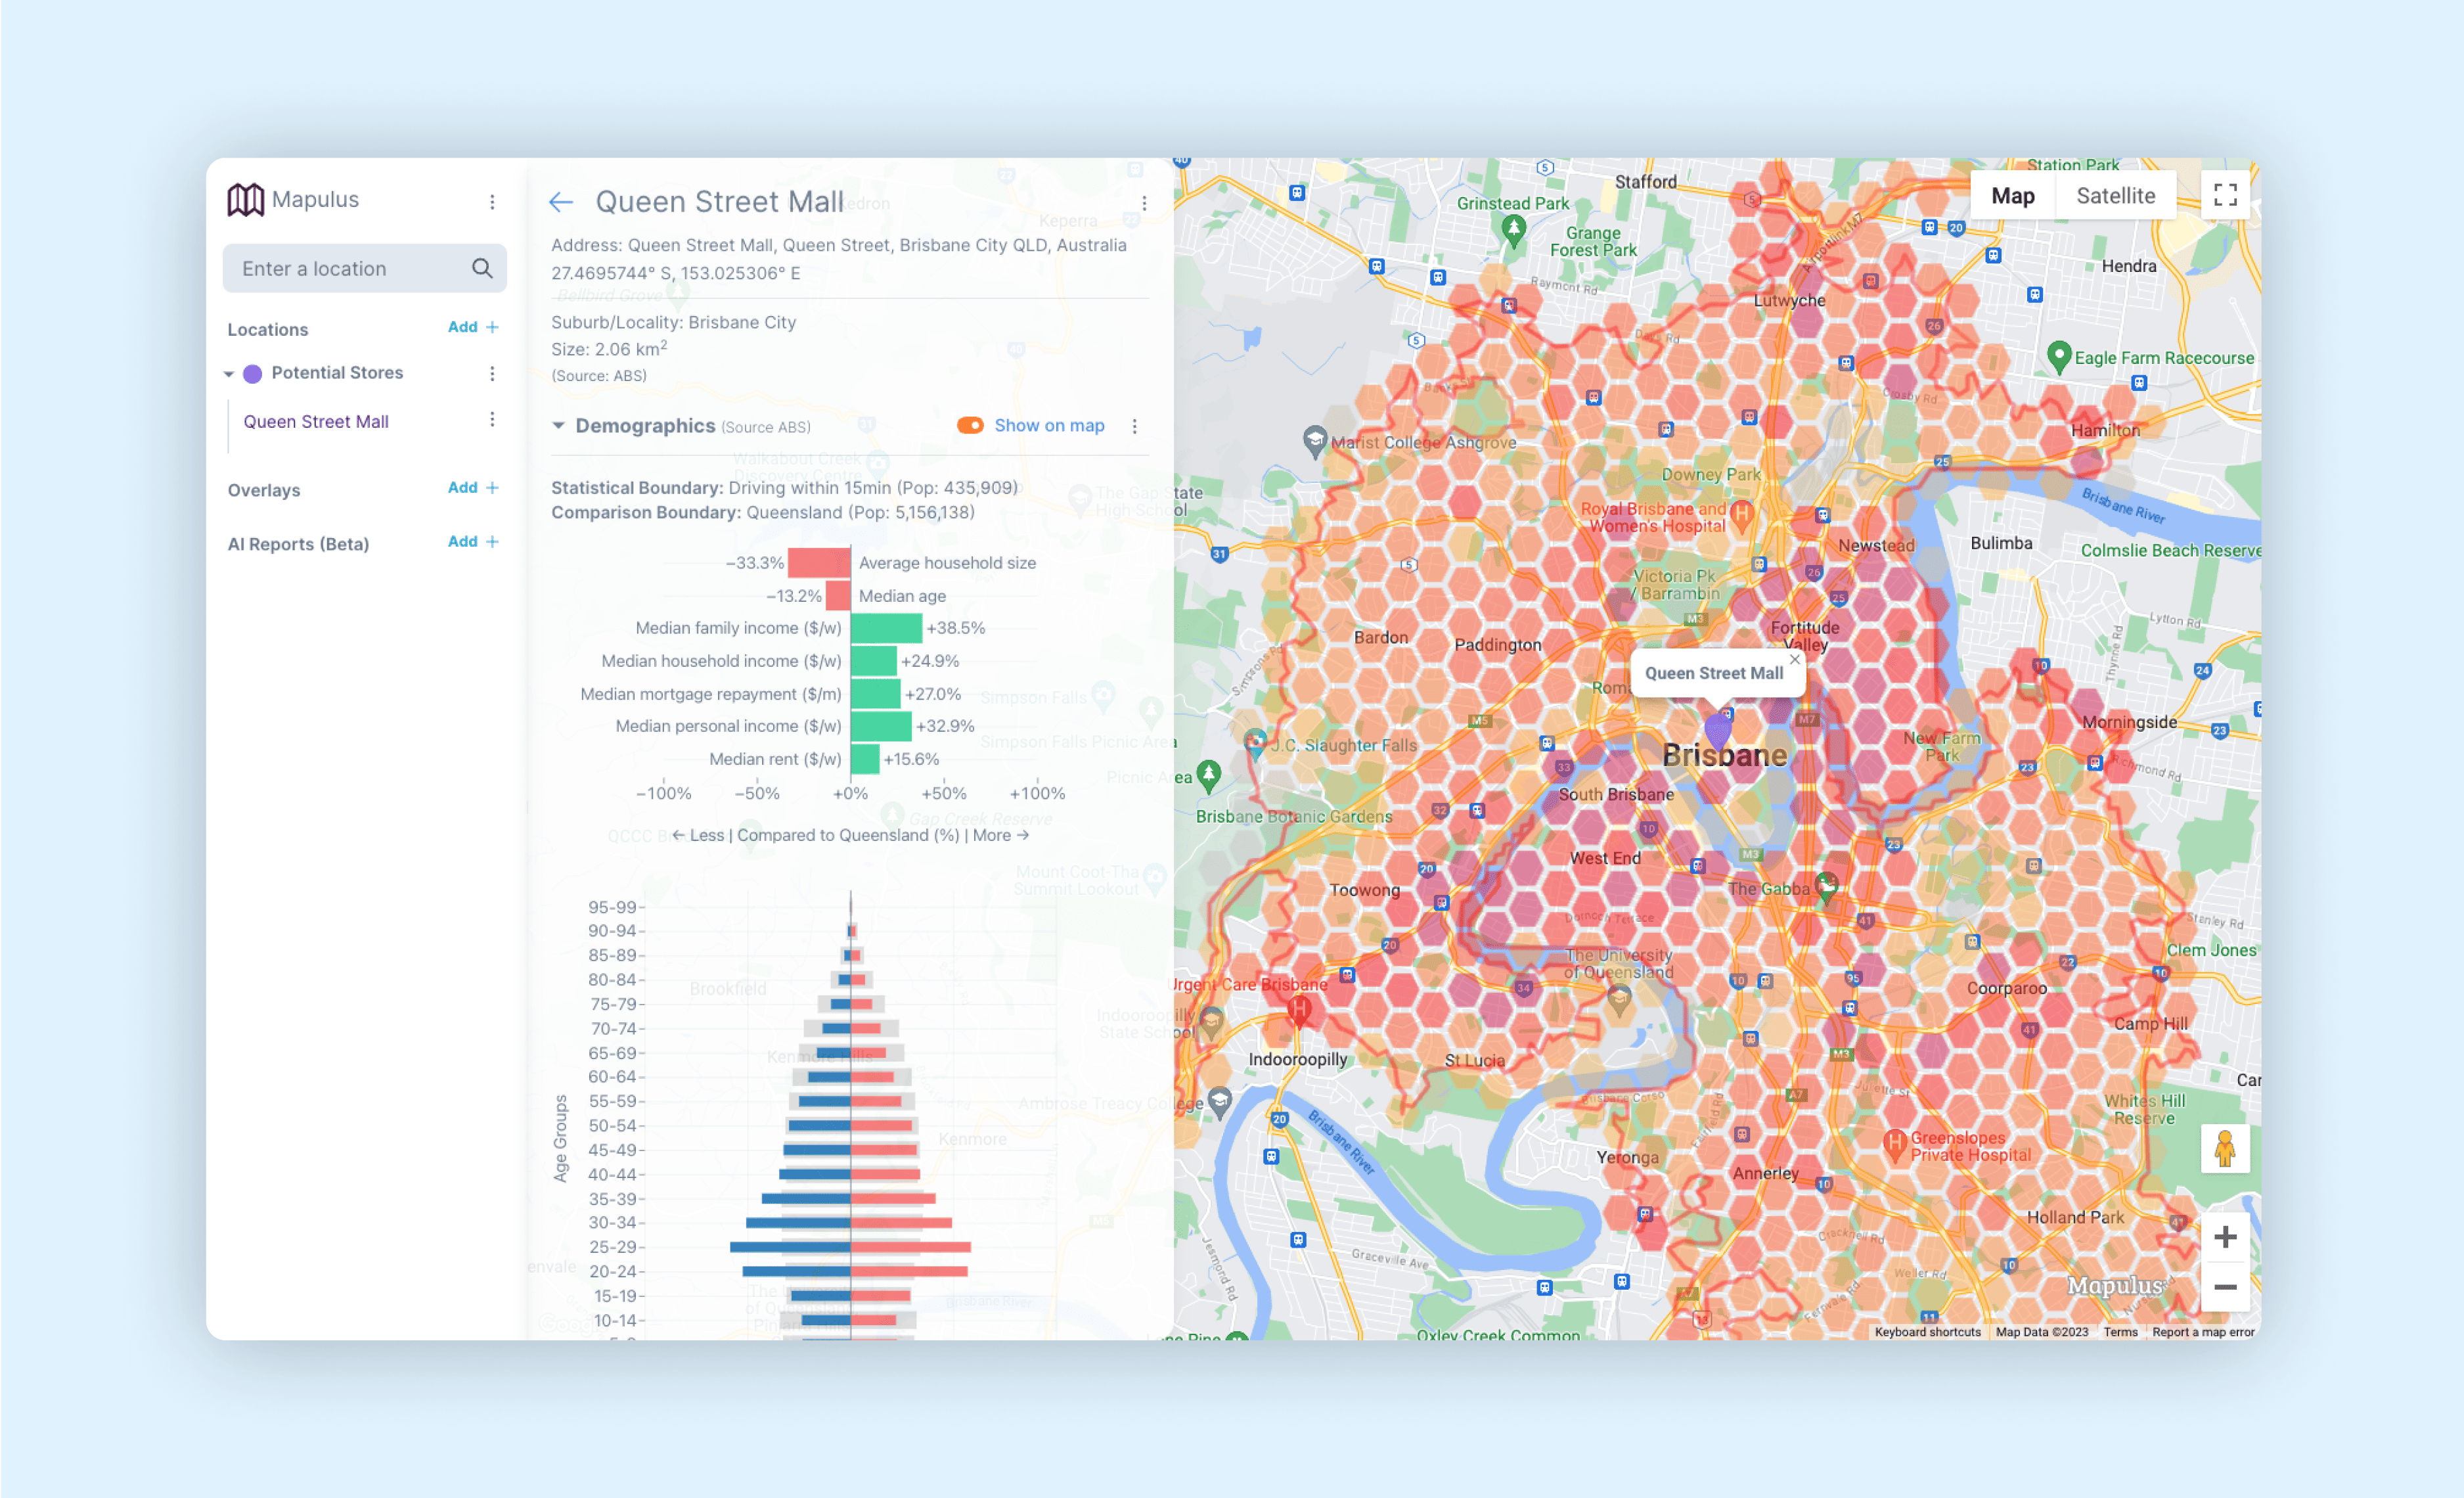
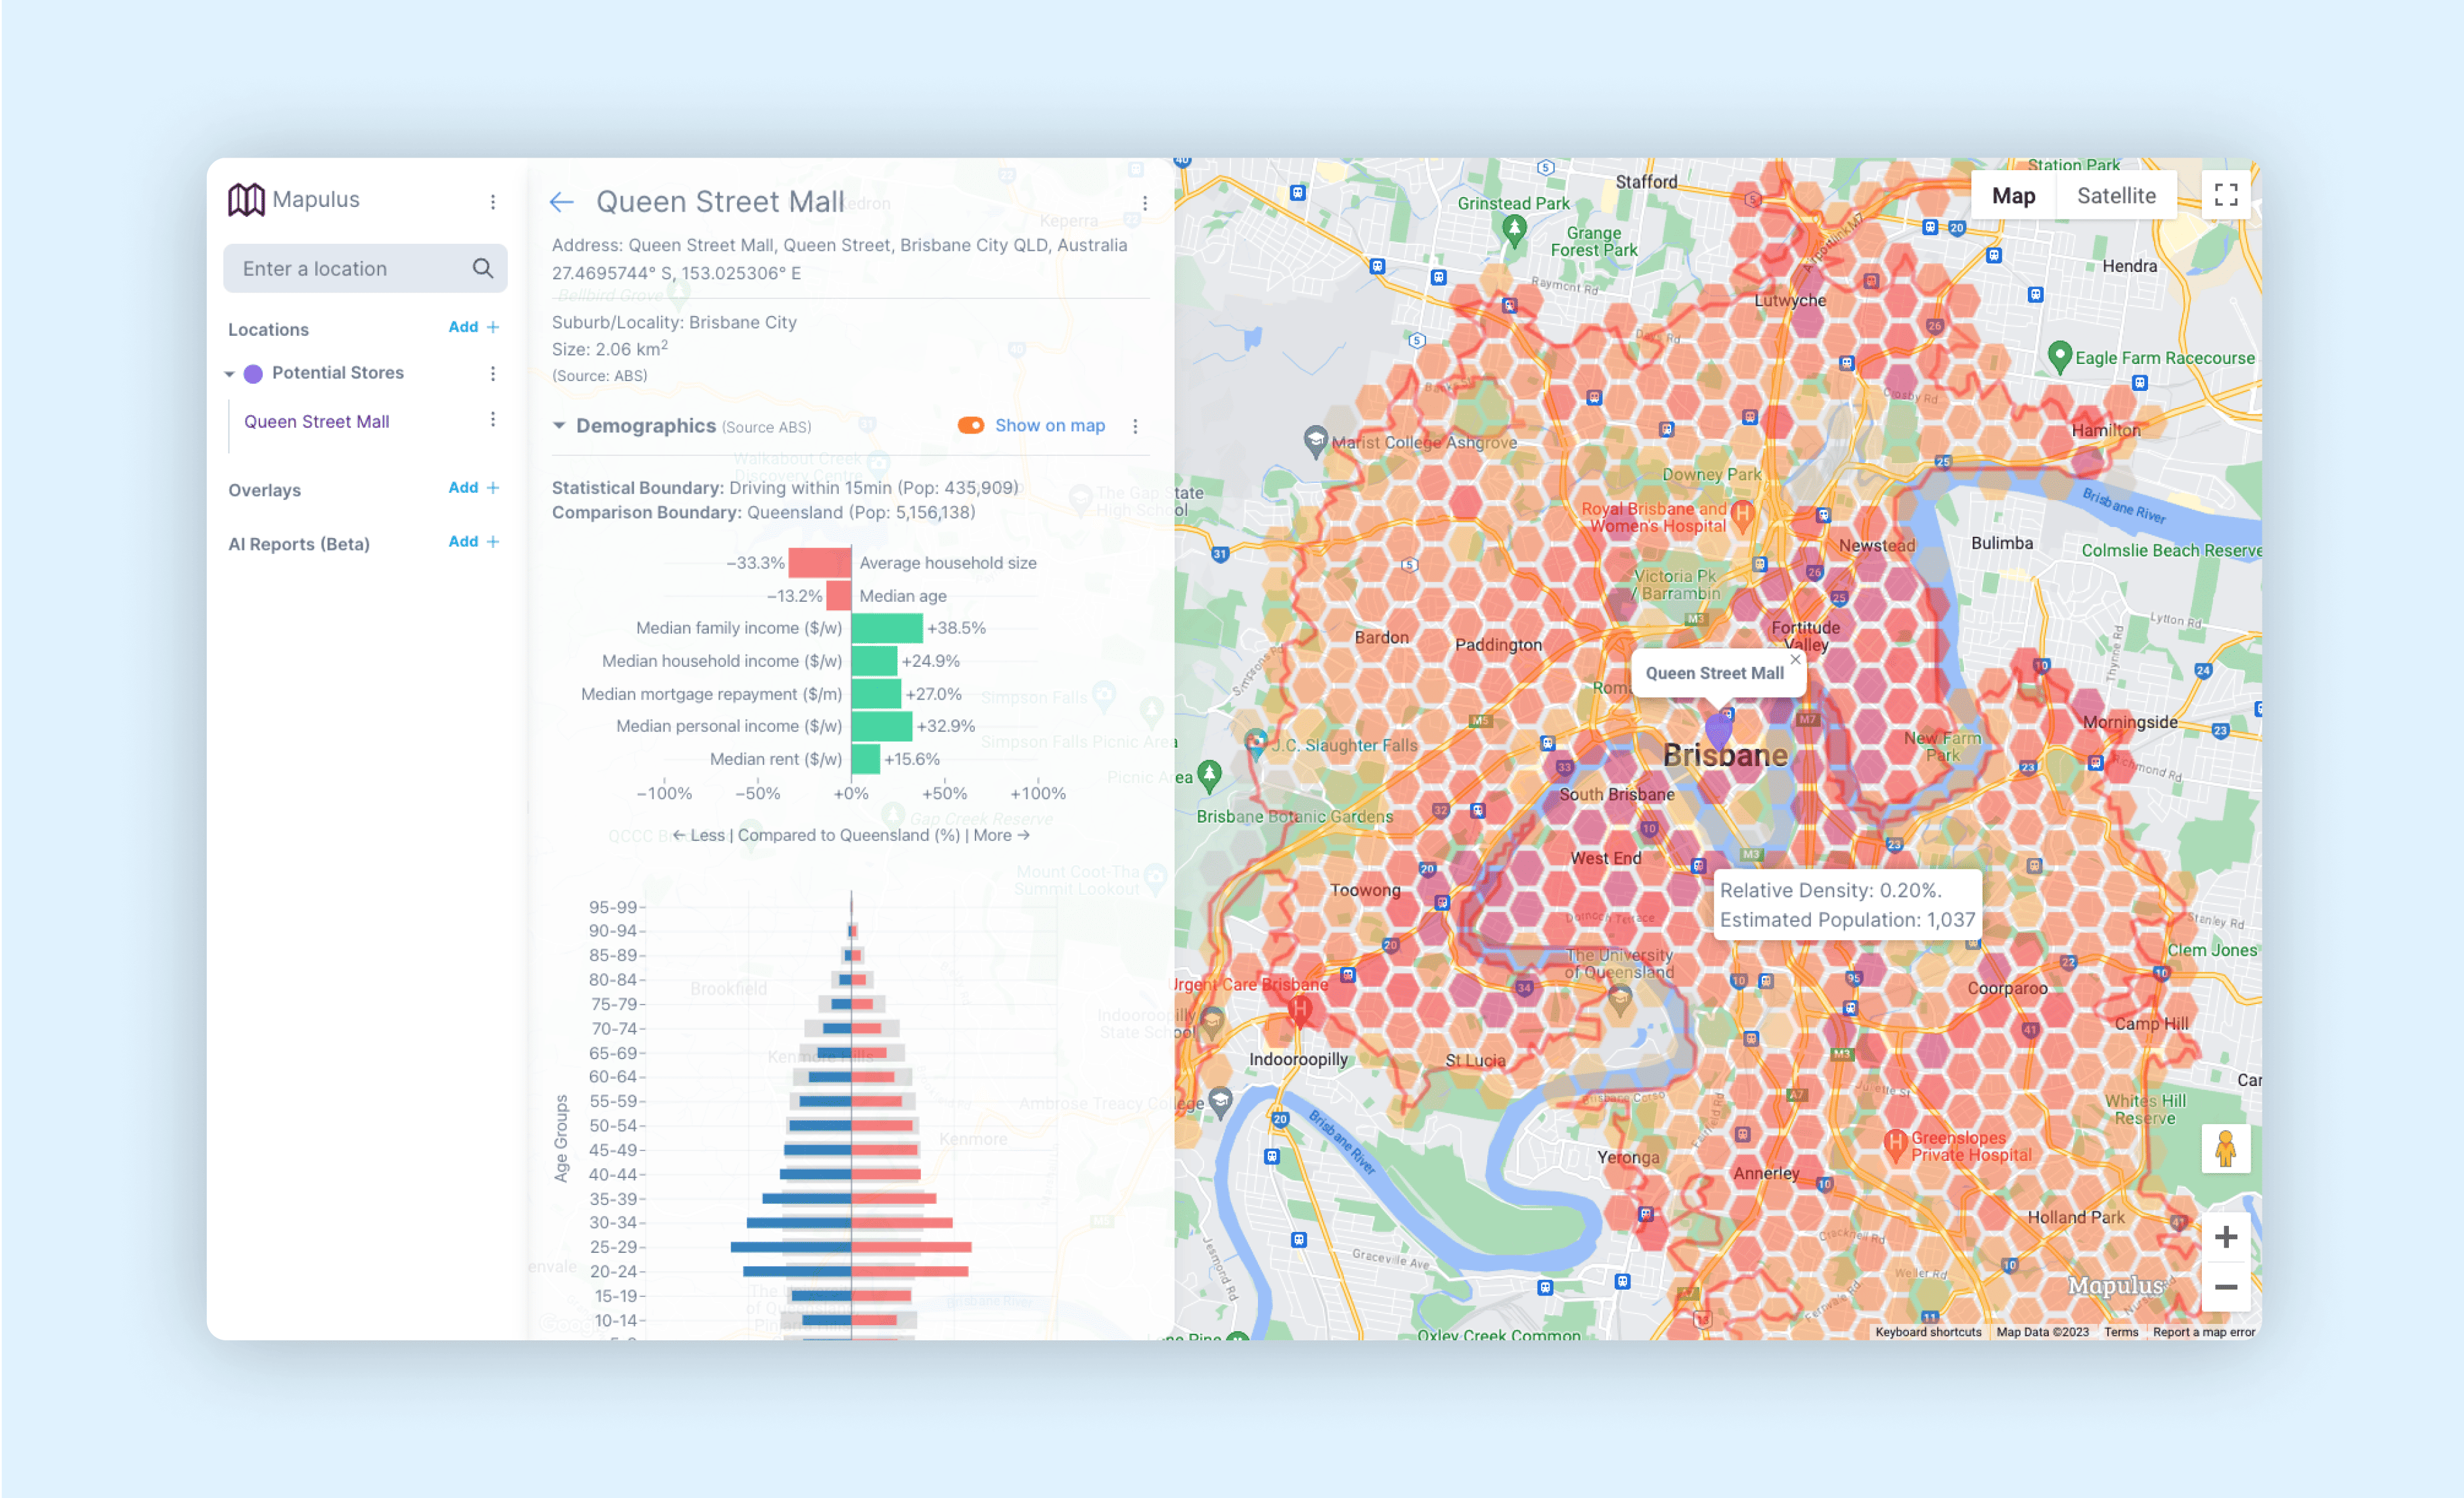
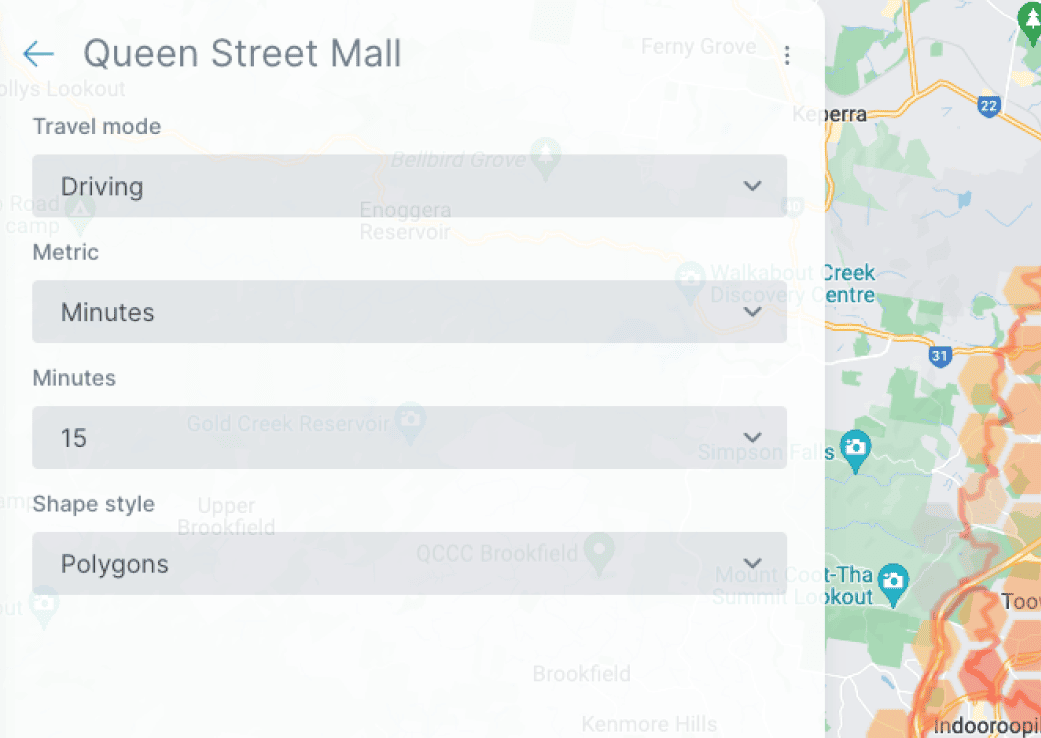
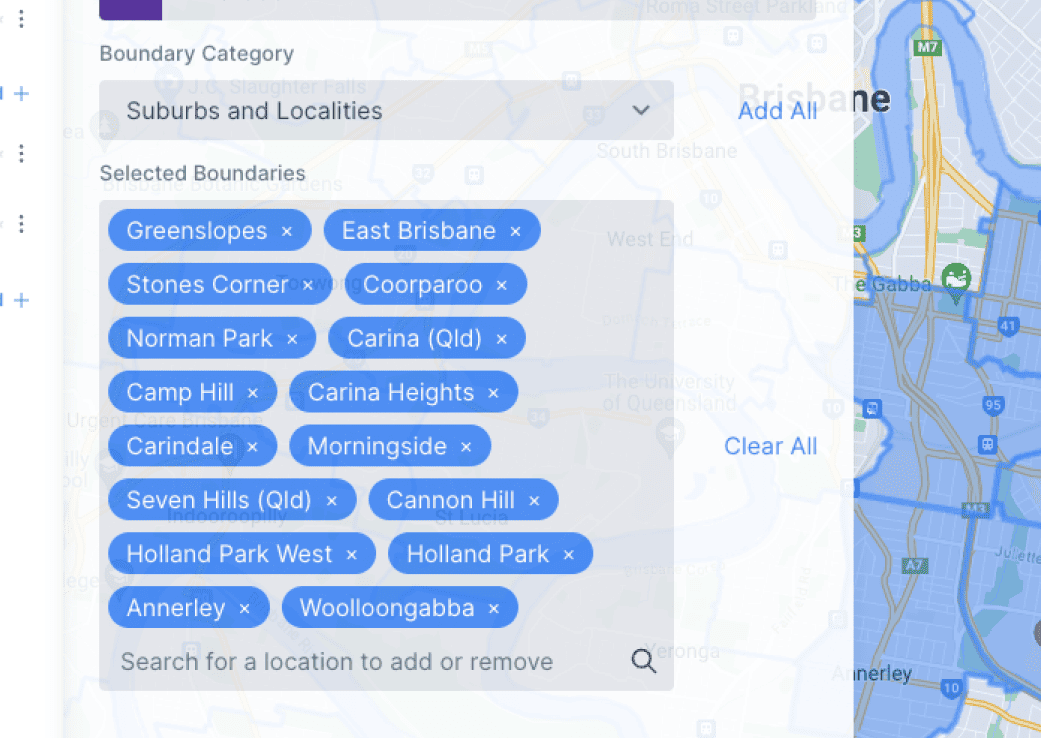
Easily define and adjust specific geographic reach, allowing you to concentrate on areas most relevant to your business needs and objectives.
Gain confidence with quality curated high-resolution data to get accurate insights. We use data from trusted sources, including the Australian Bureau of Statistics (ABS).
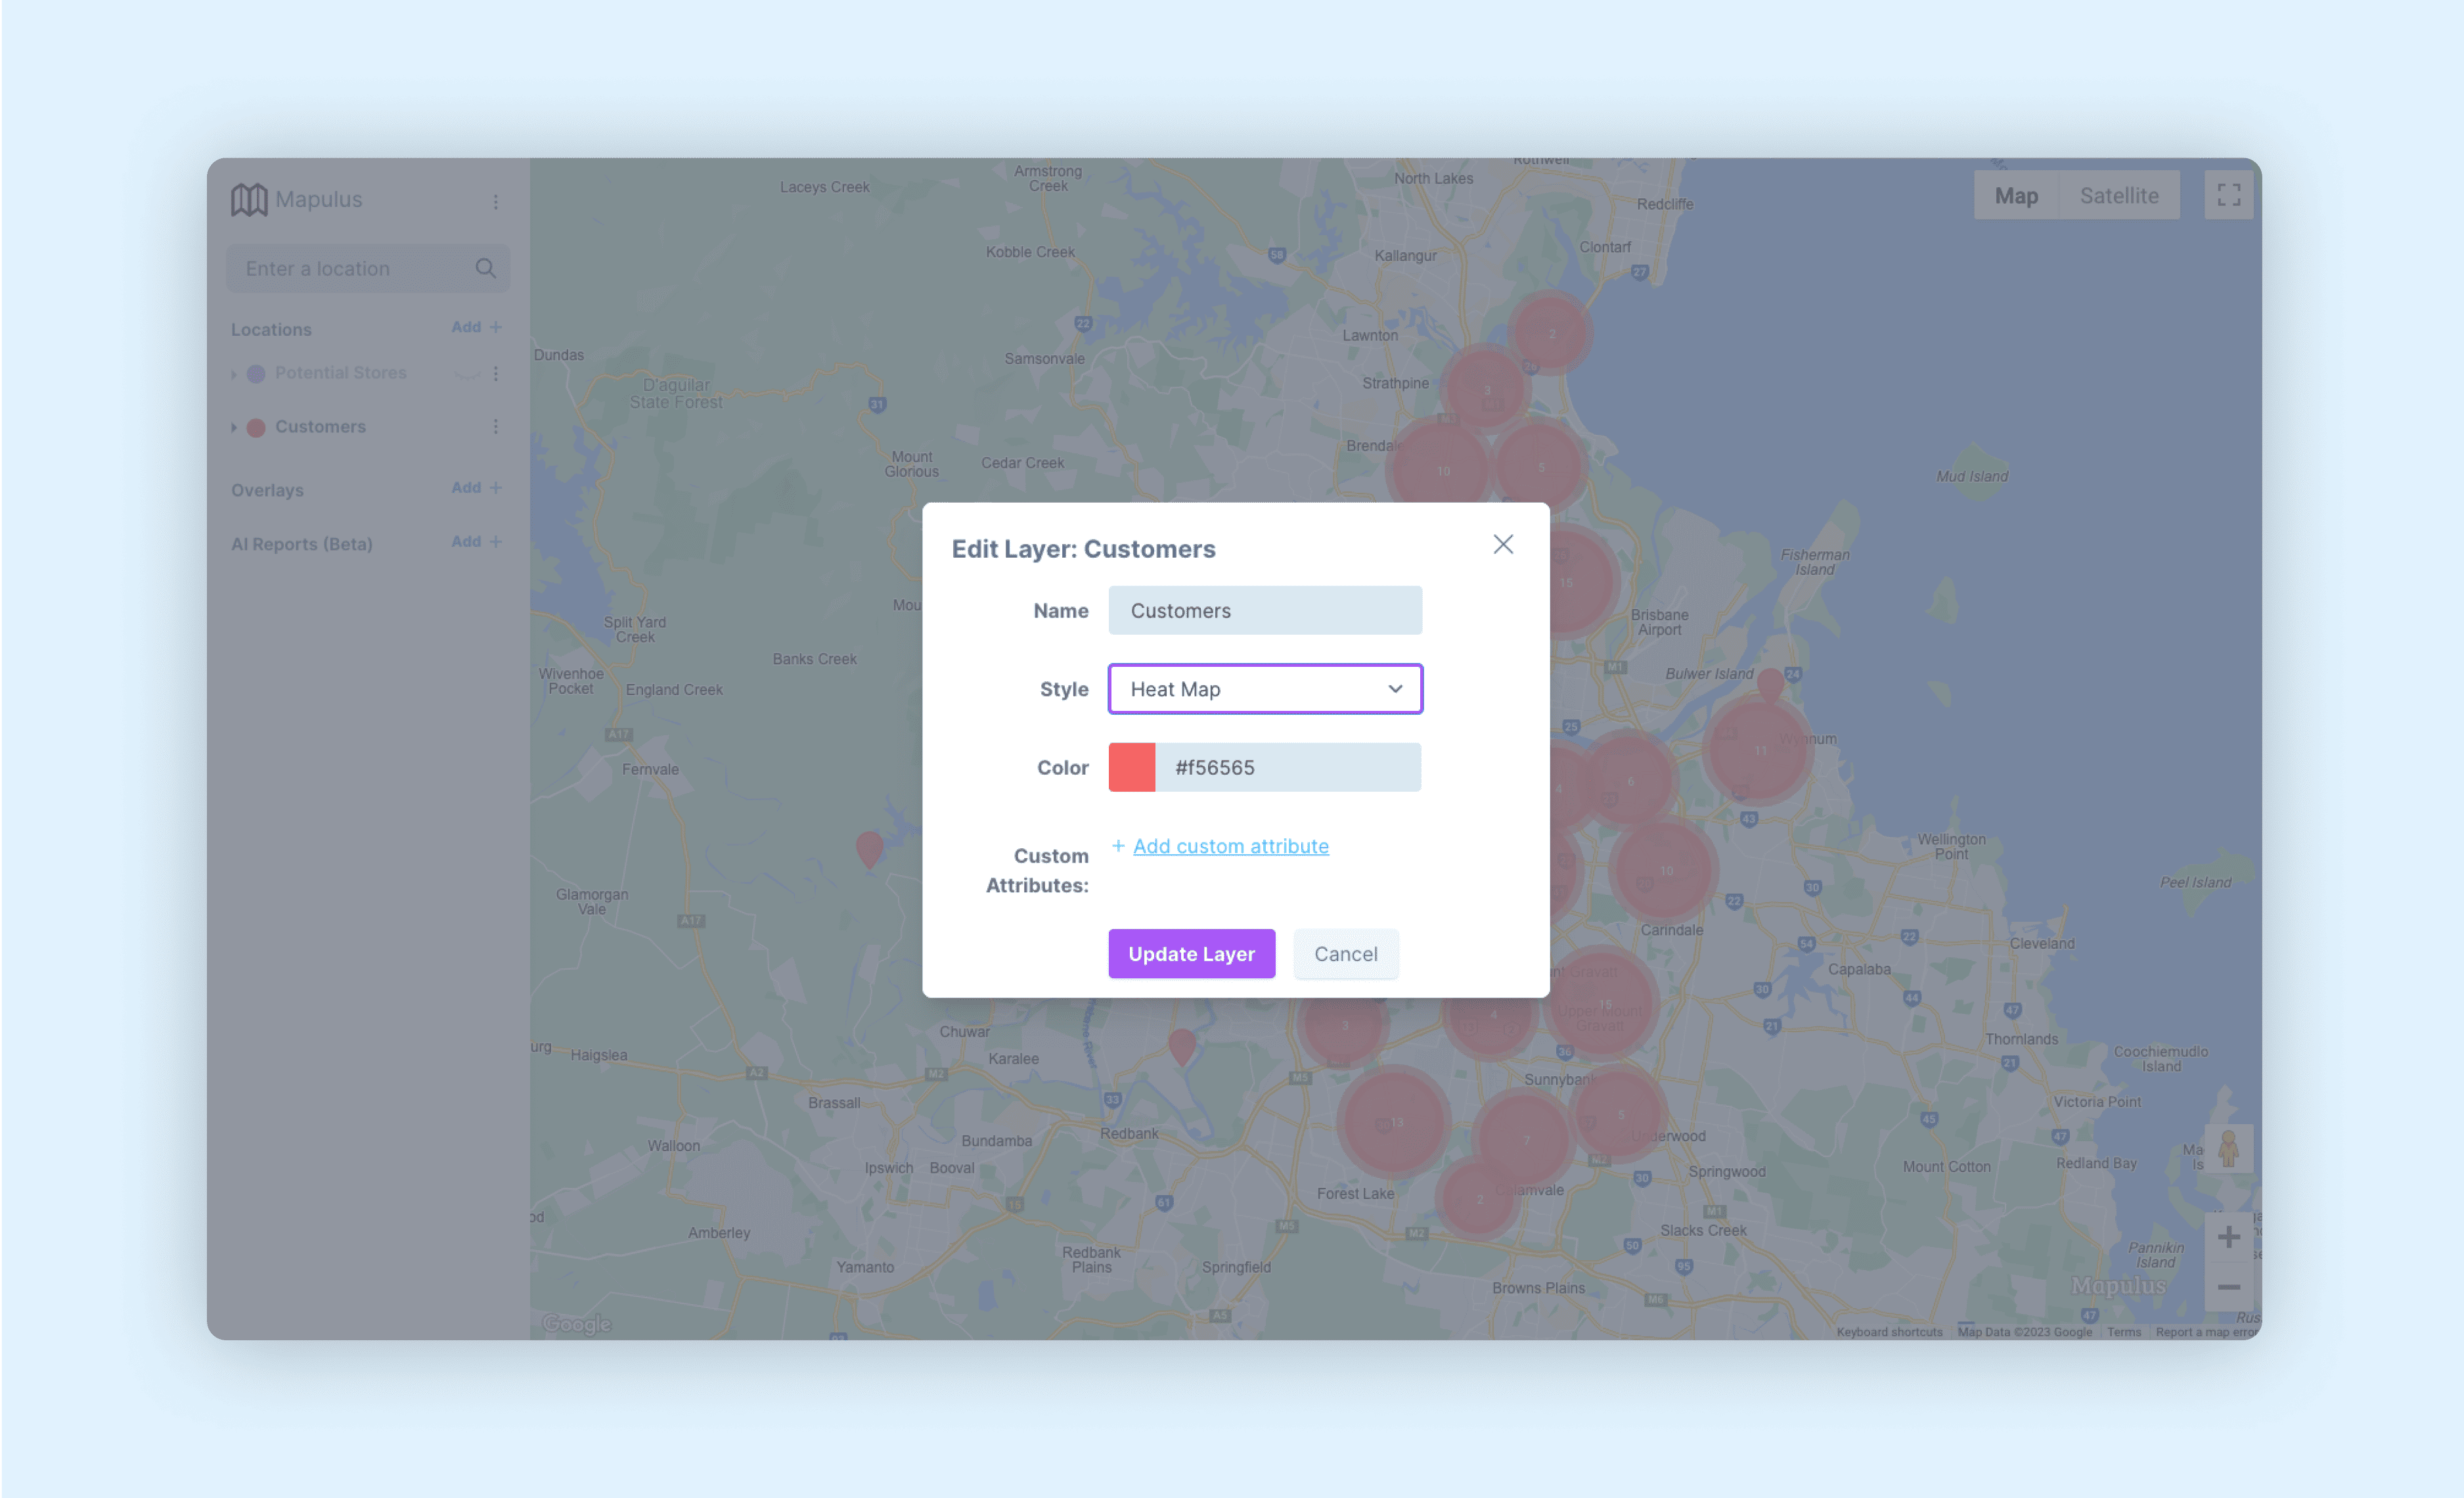
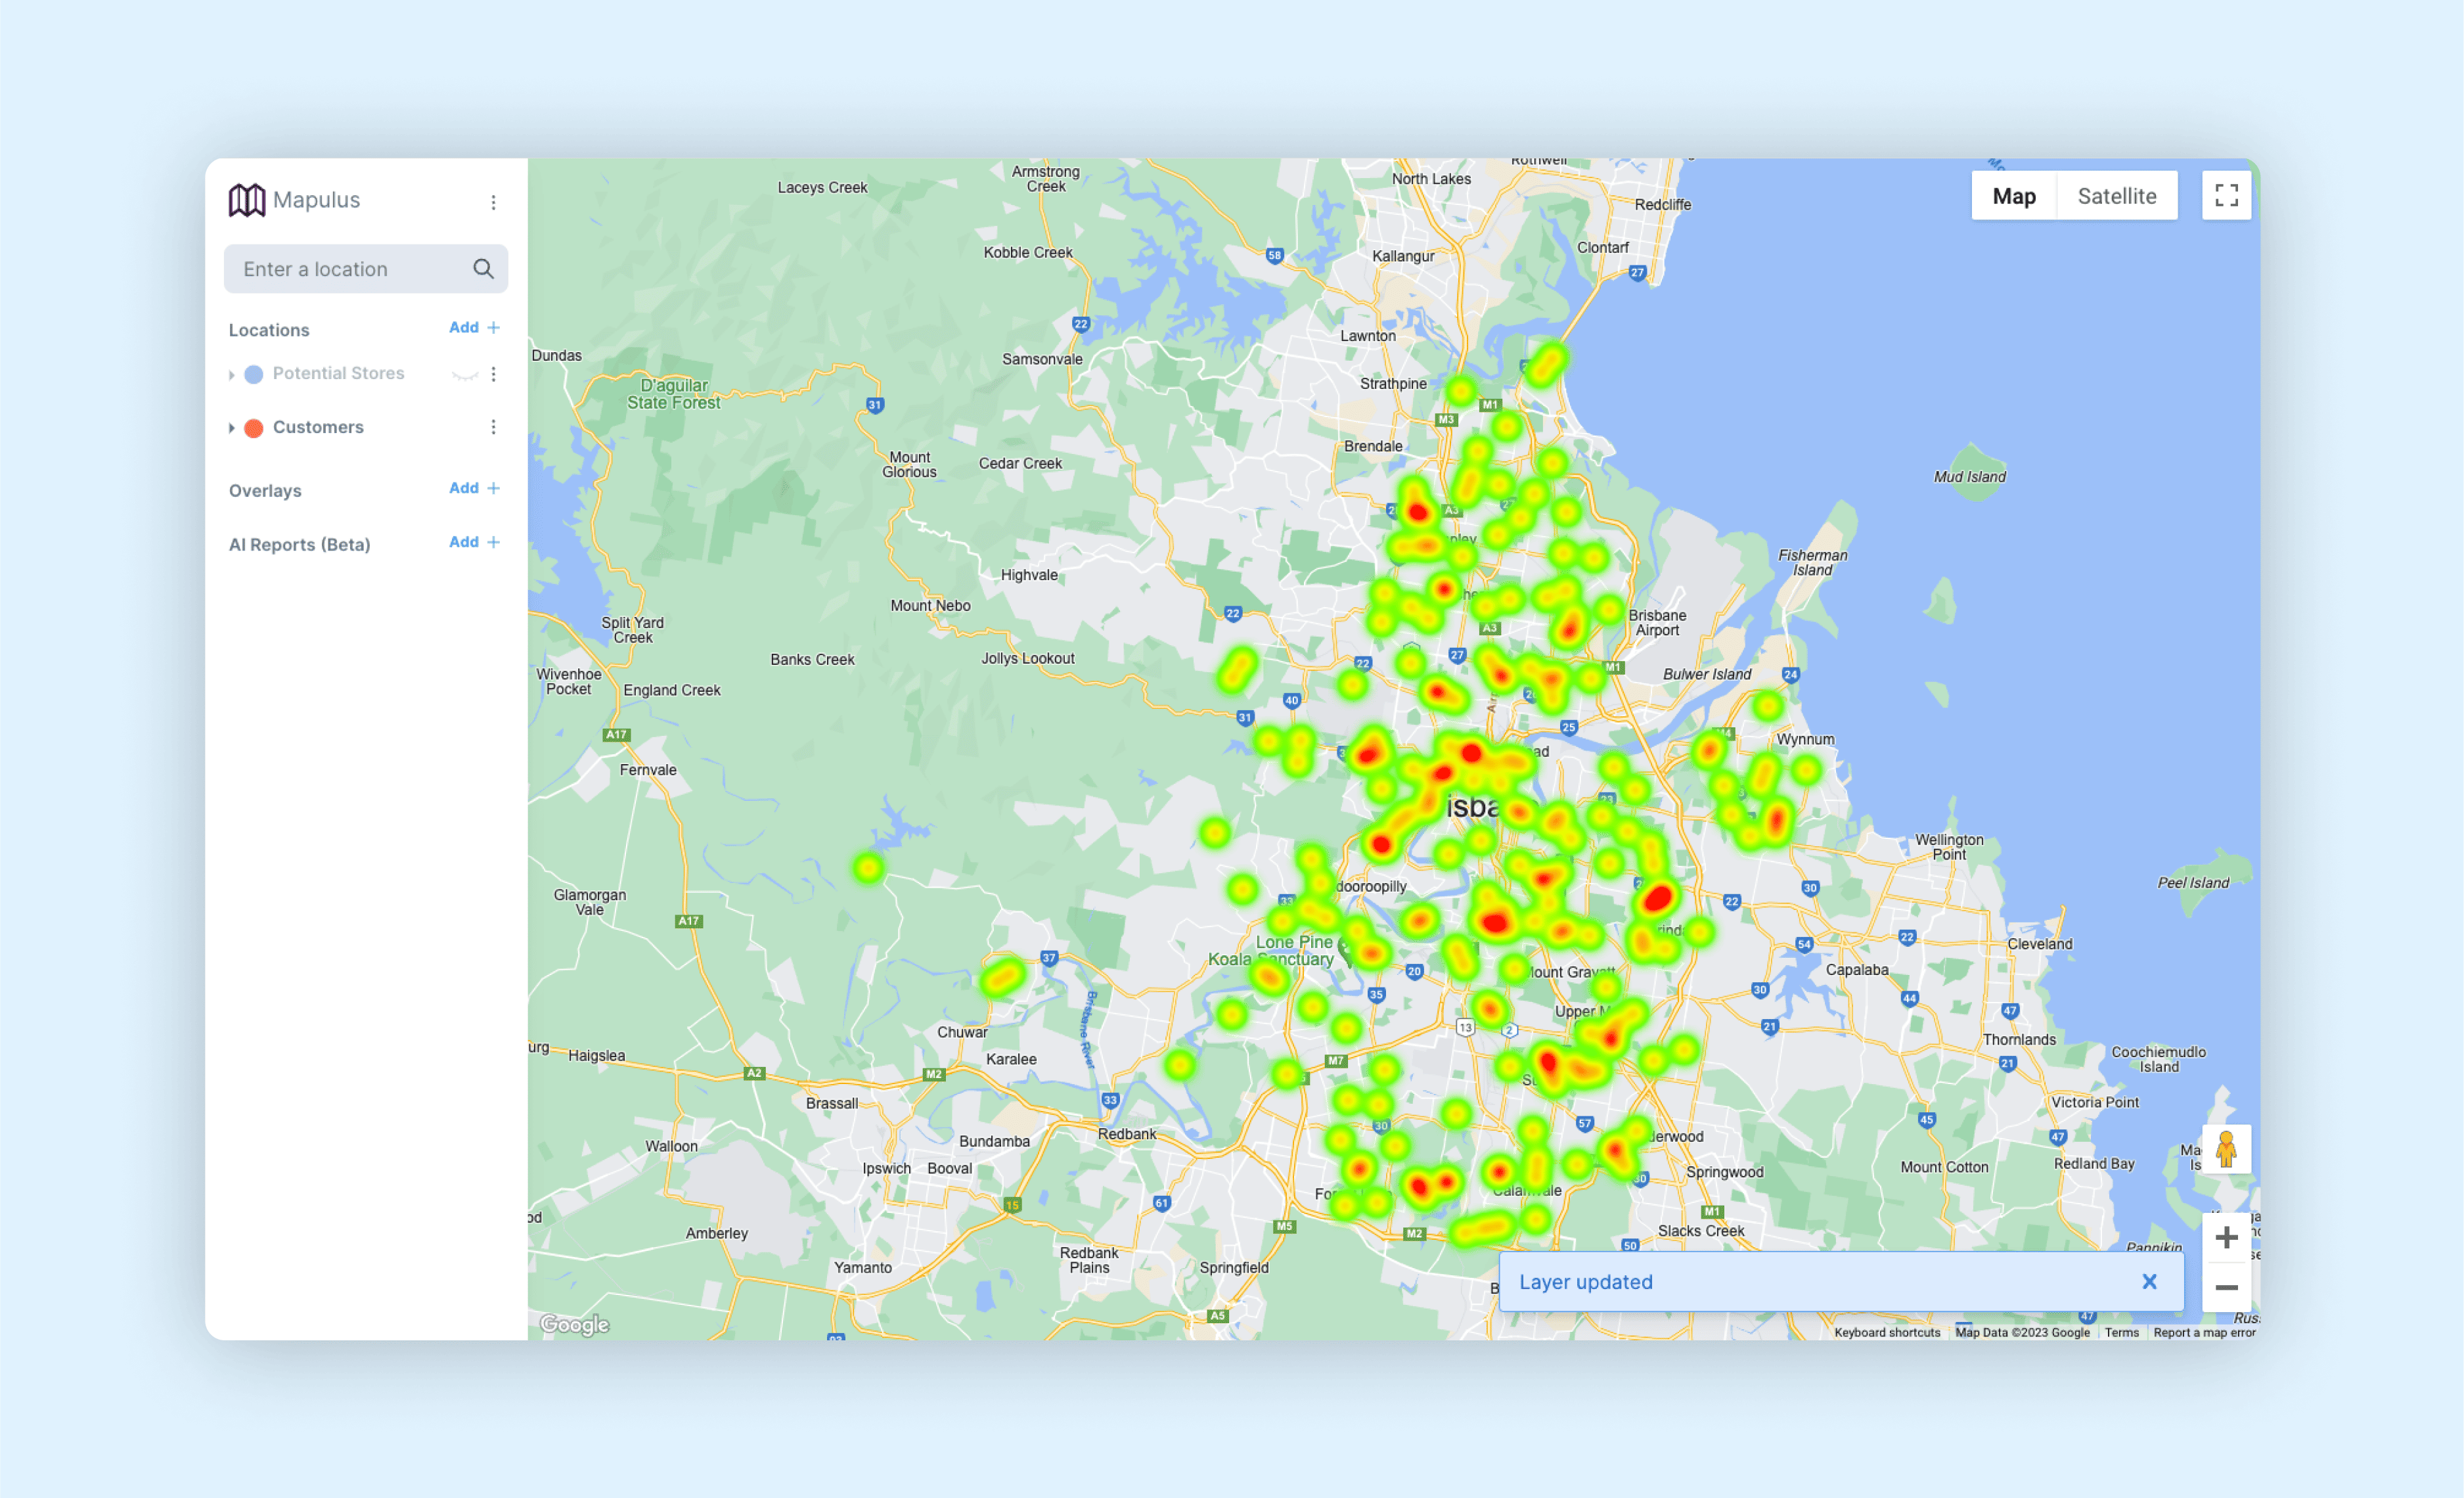
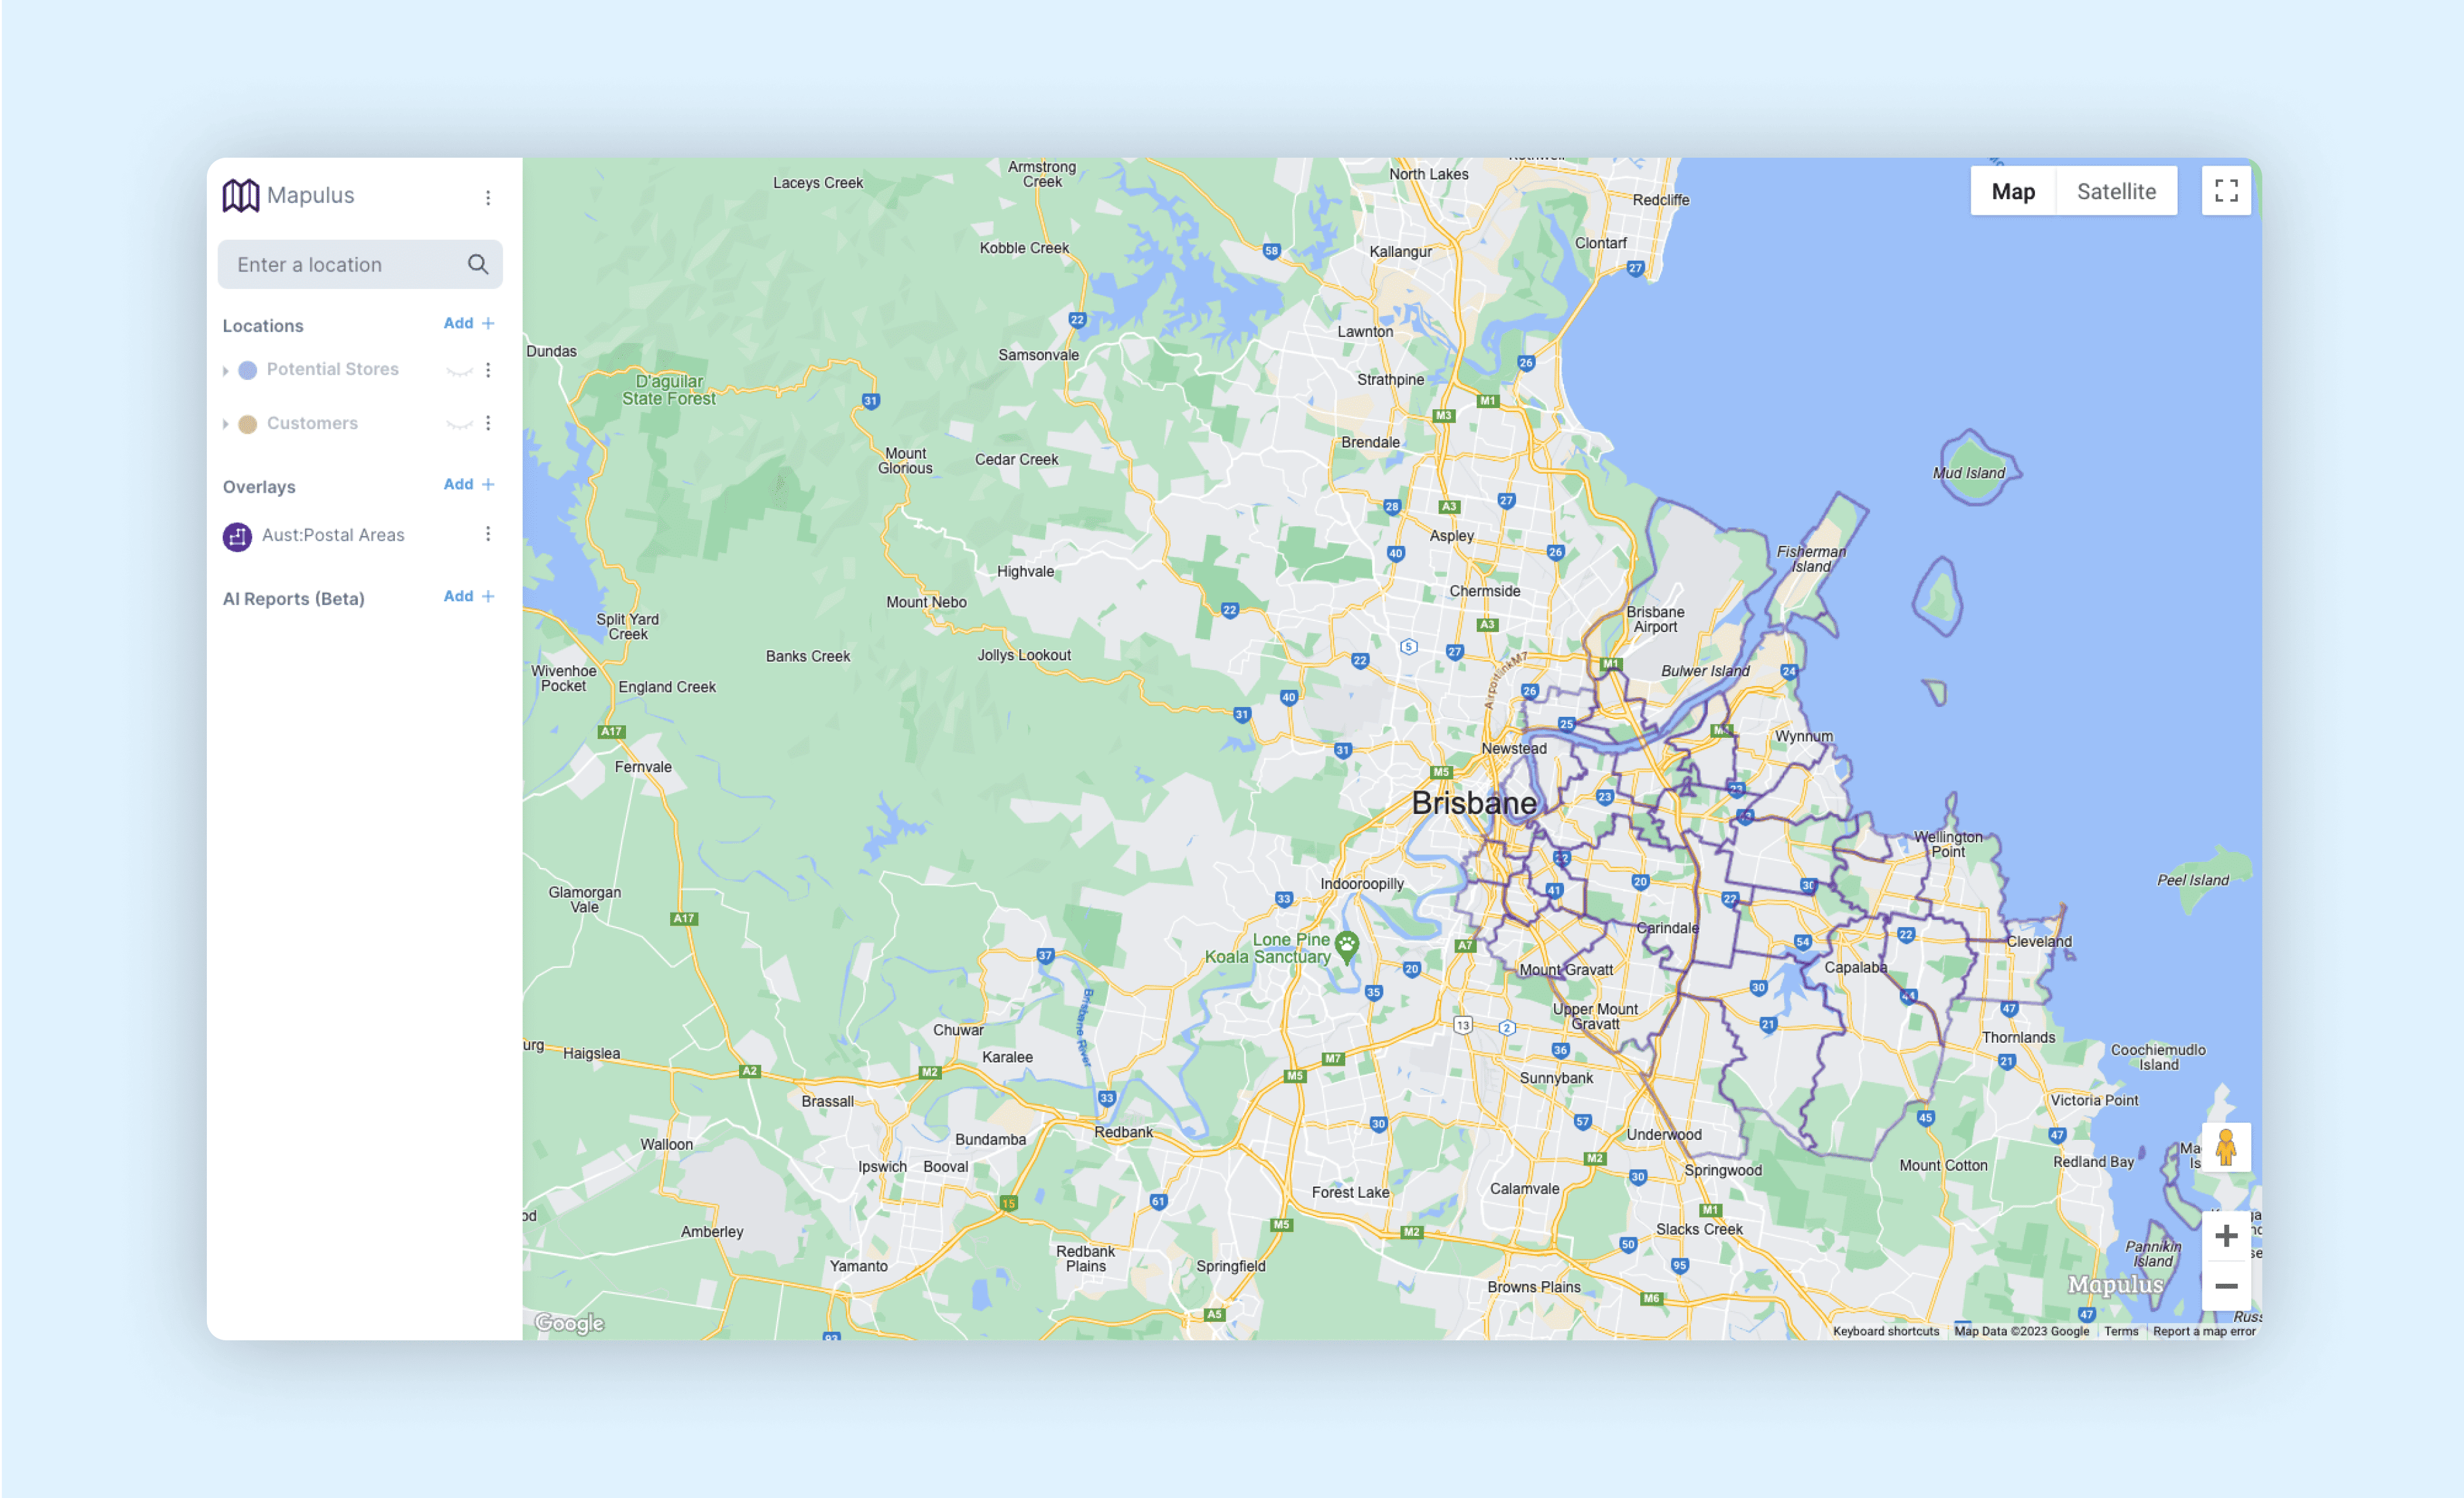
Experience data in an entirely new light, with clear and comprehensible visual presentations that make analysis and interpretation effortless.
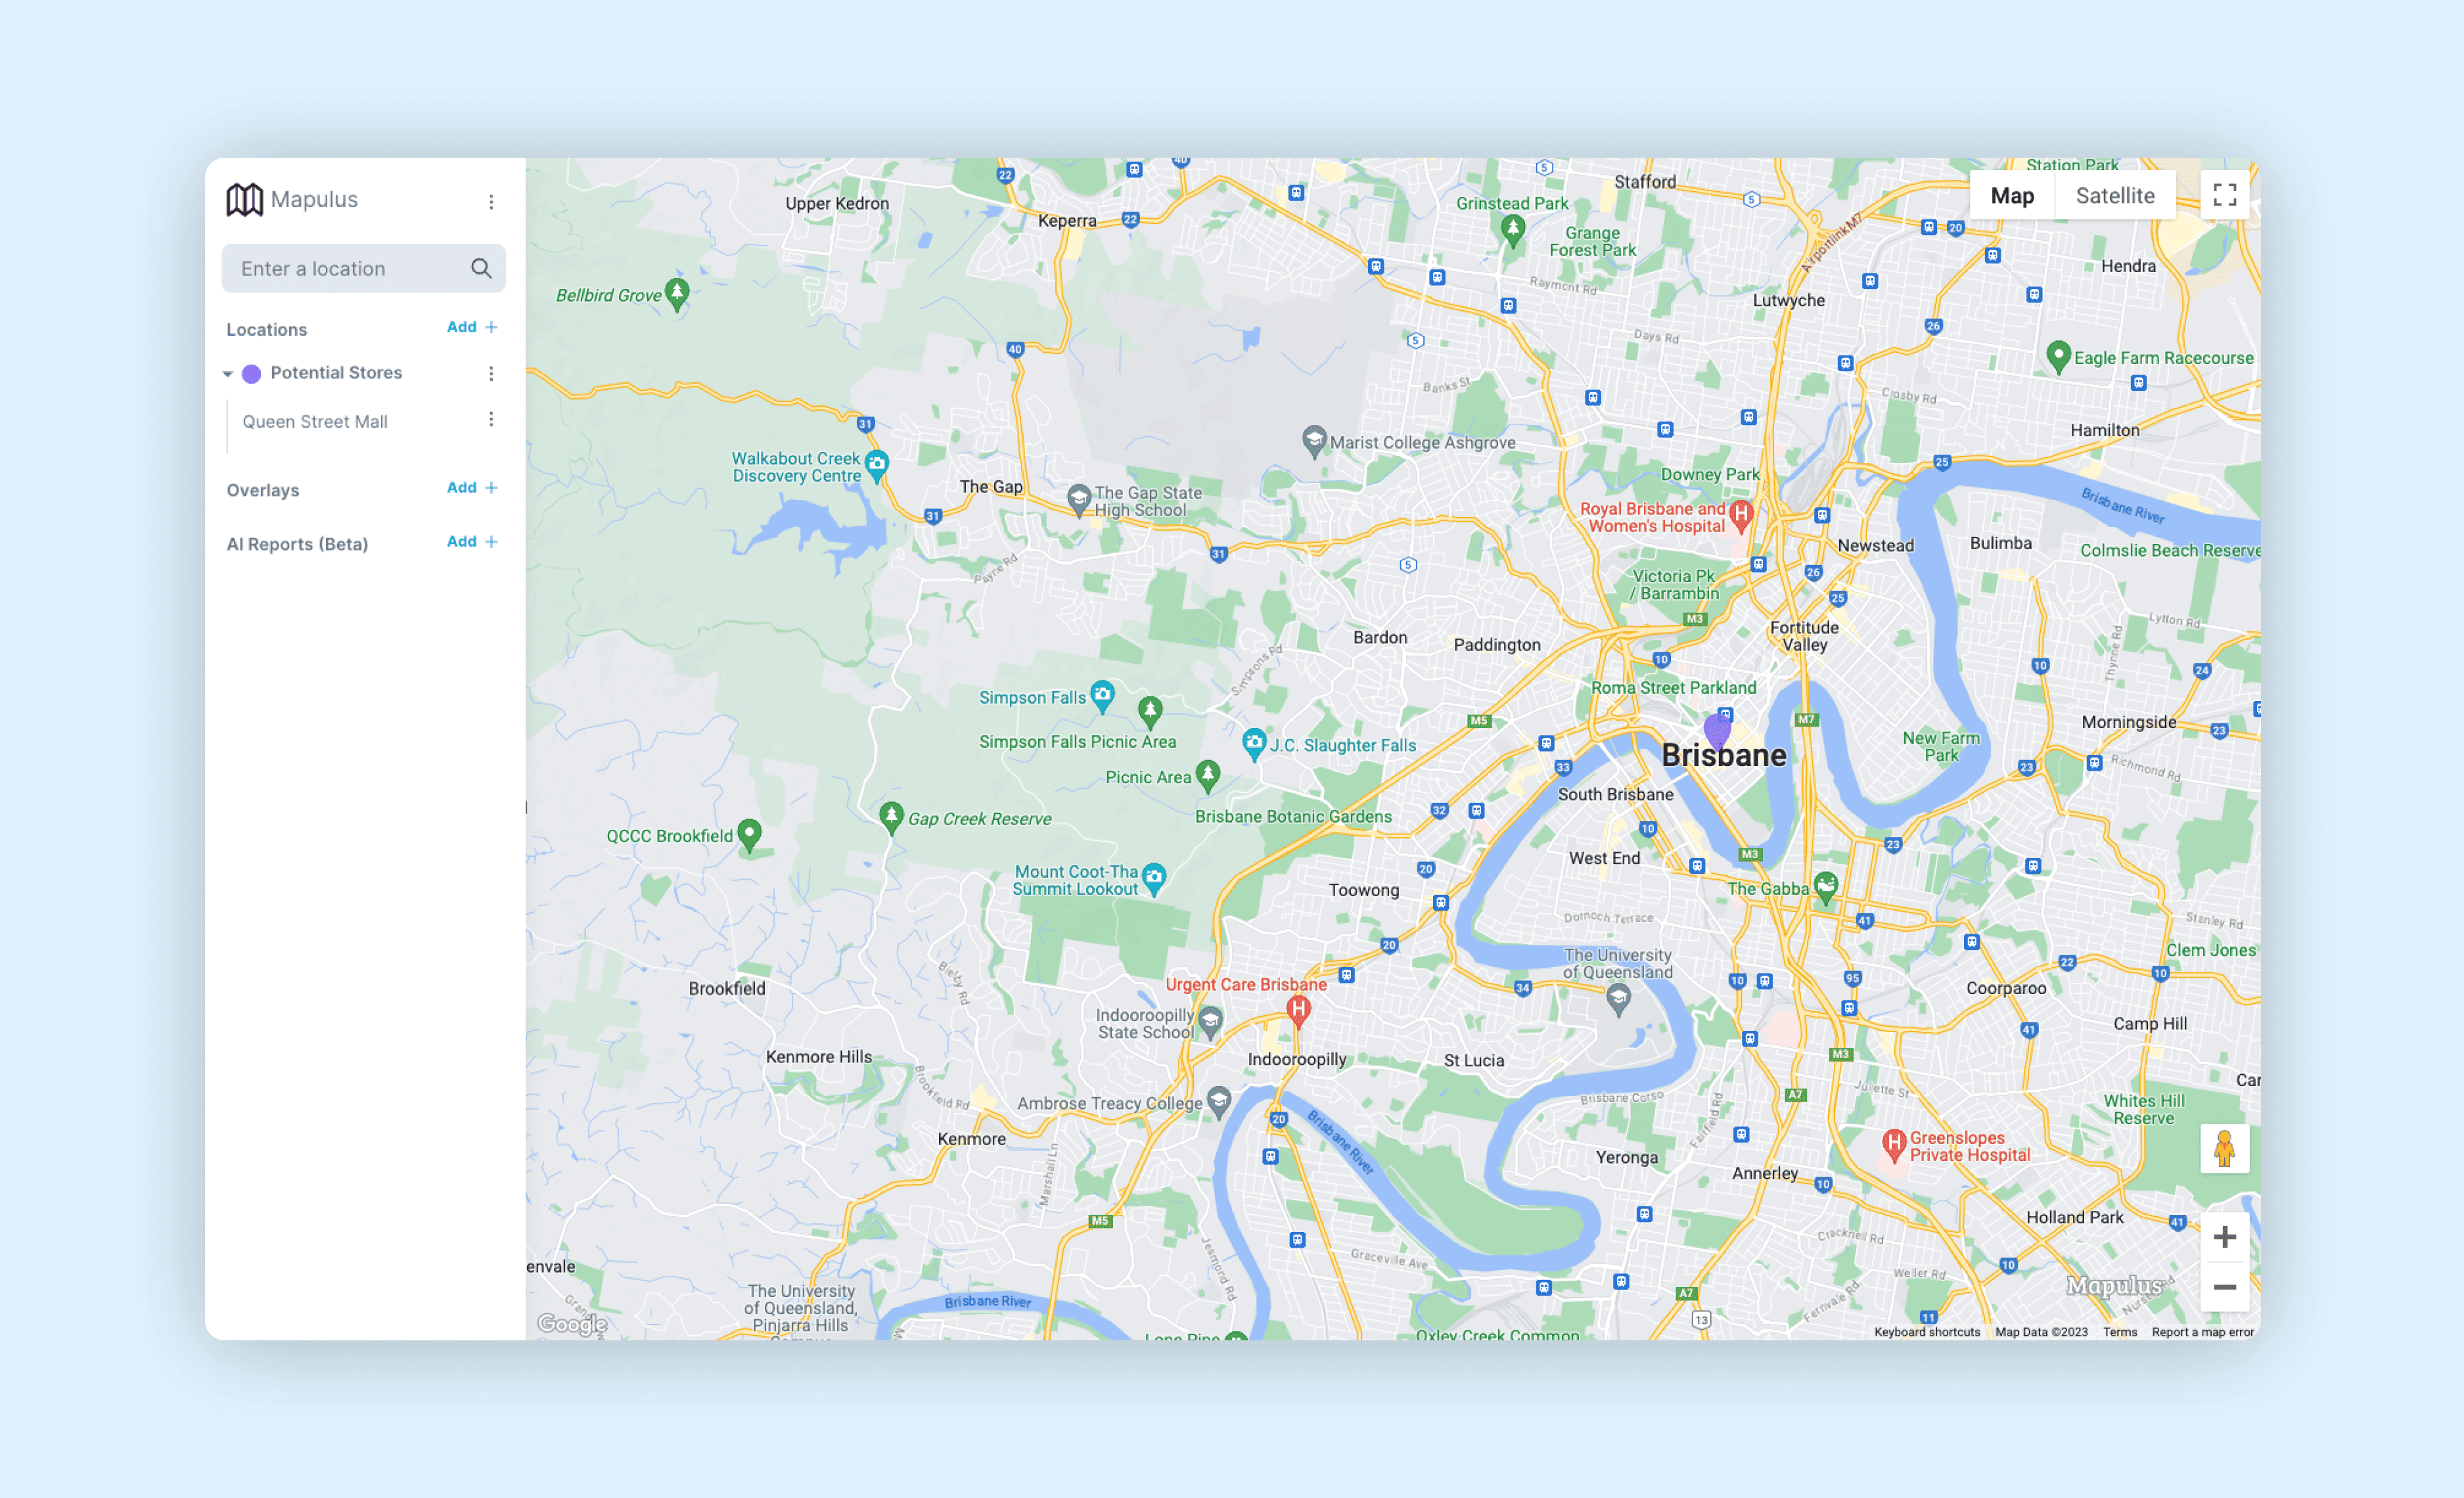
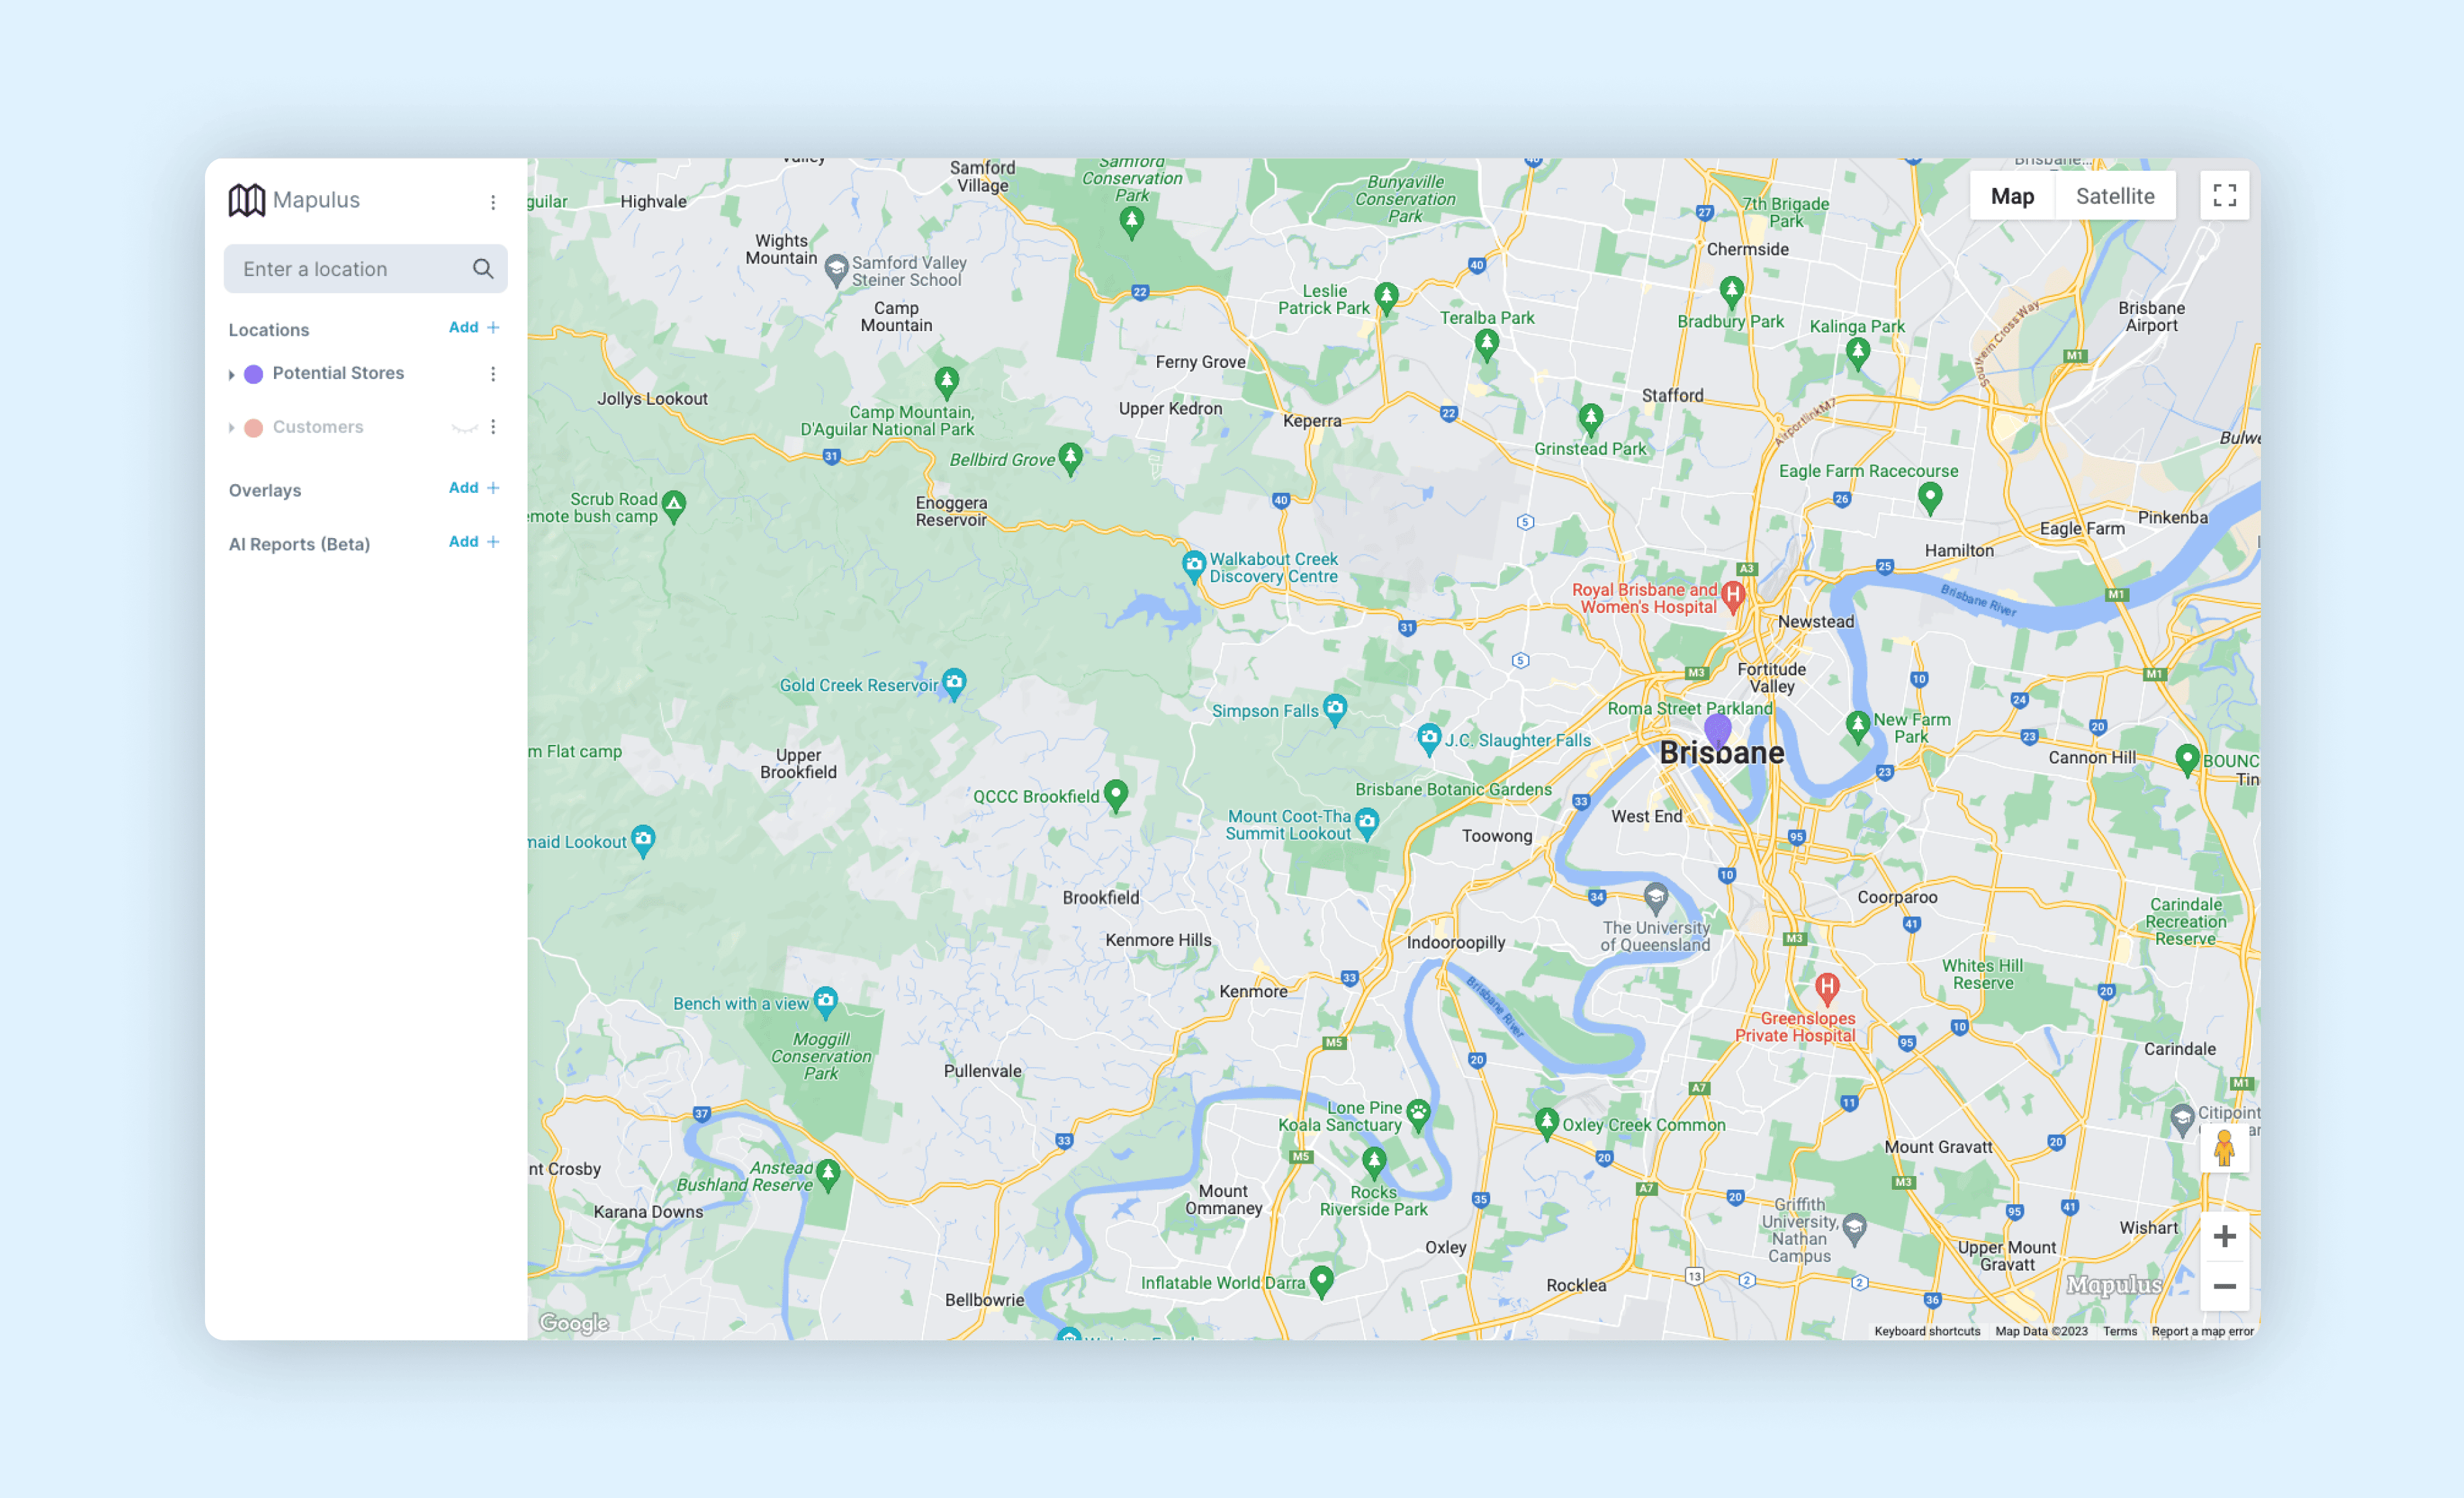
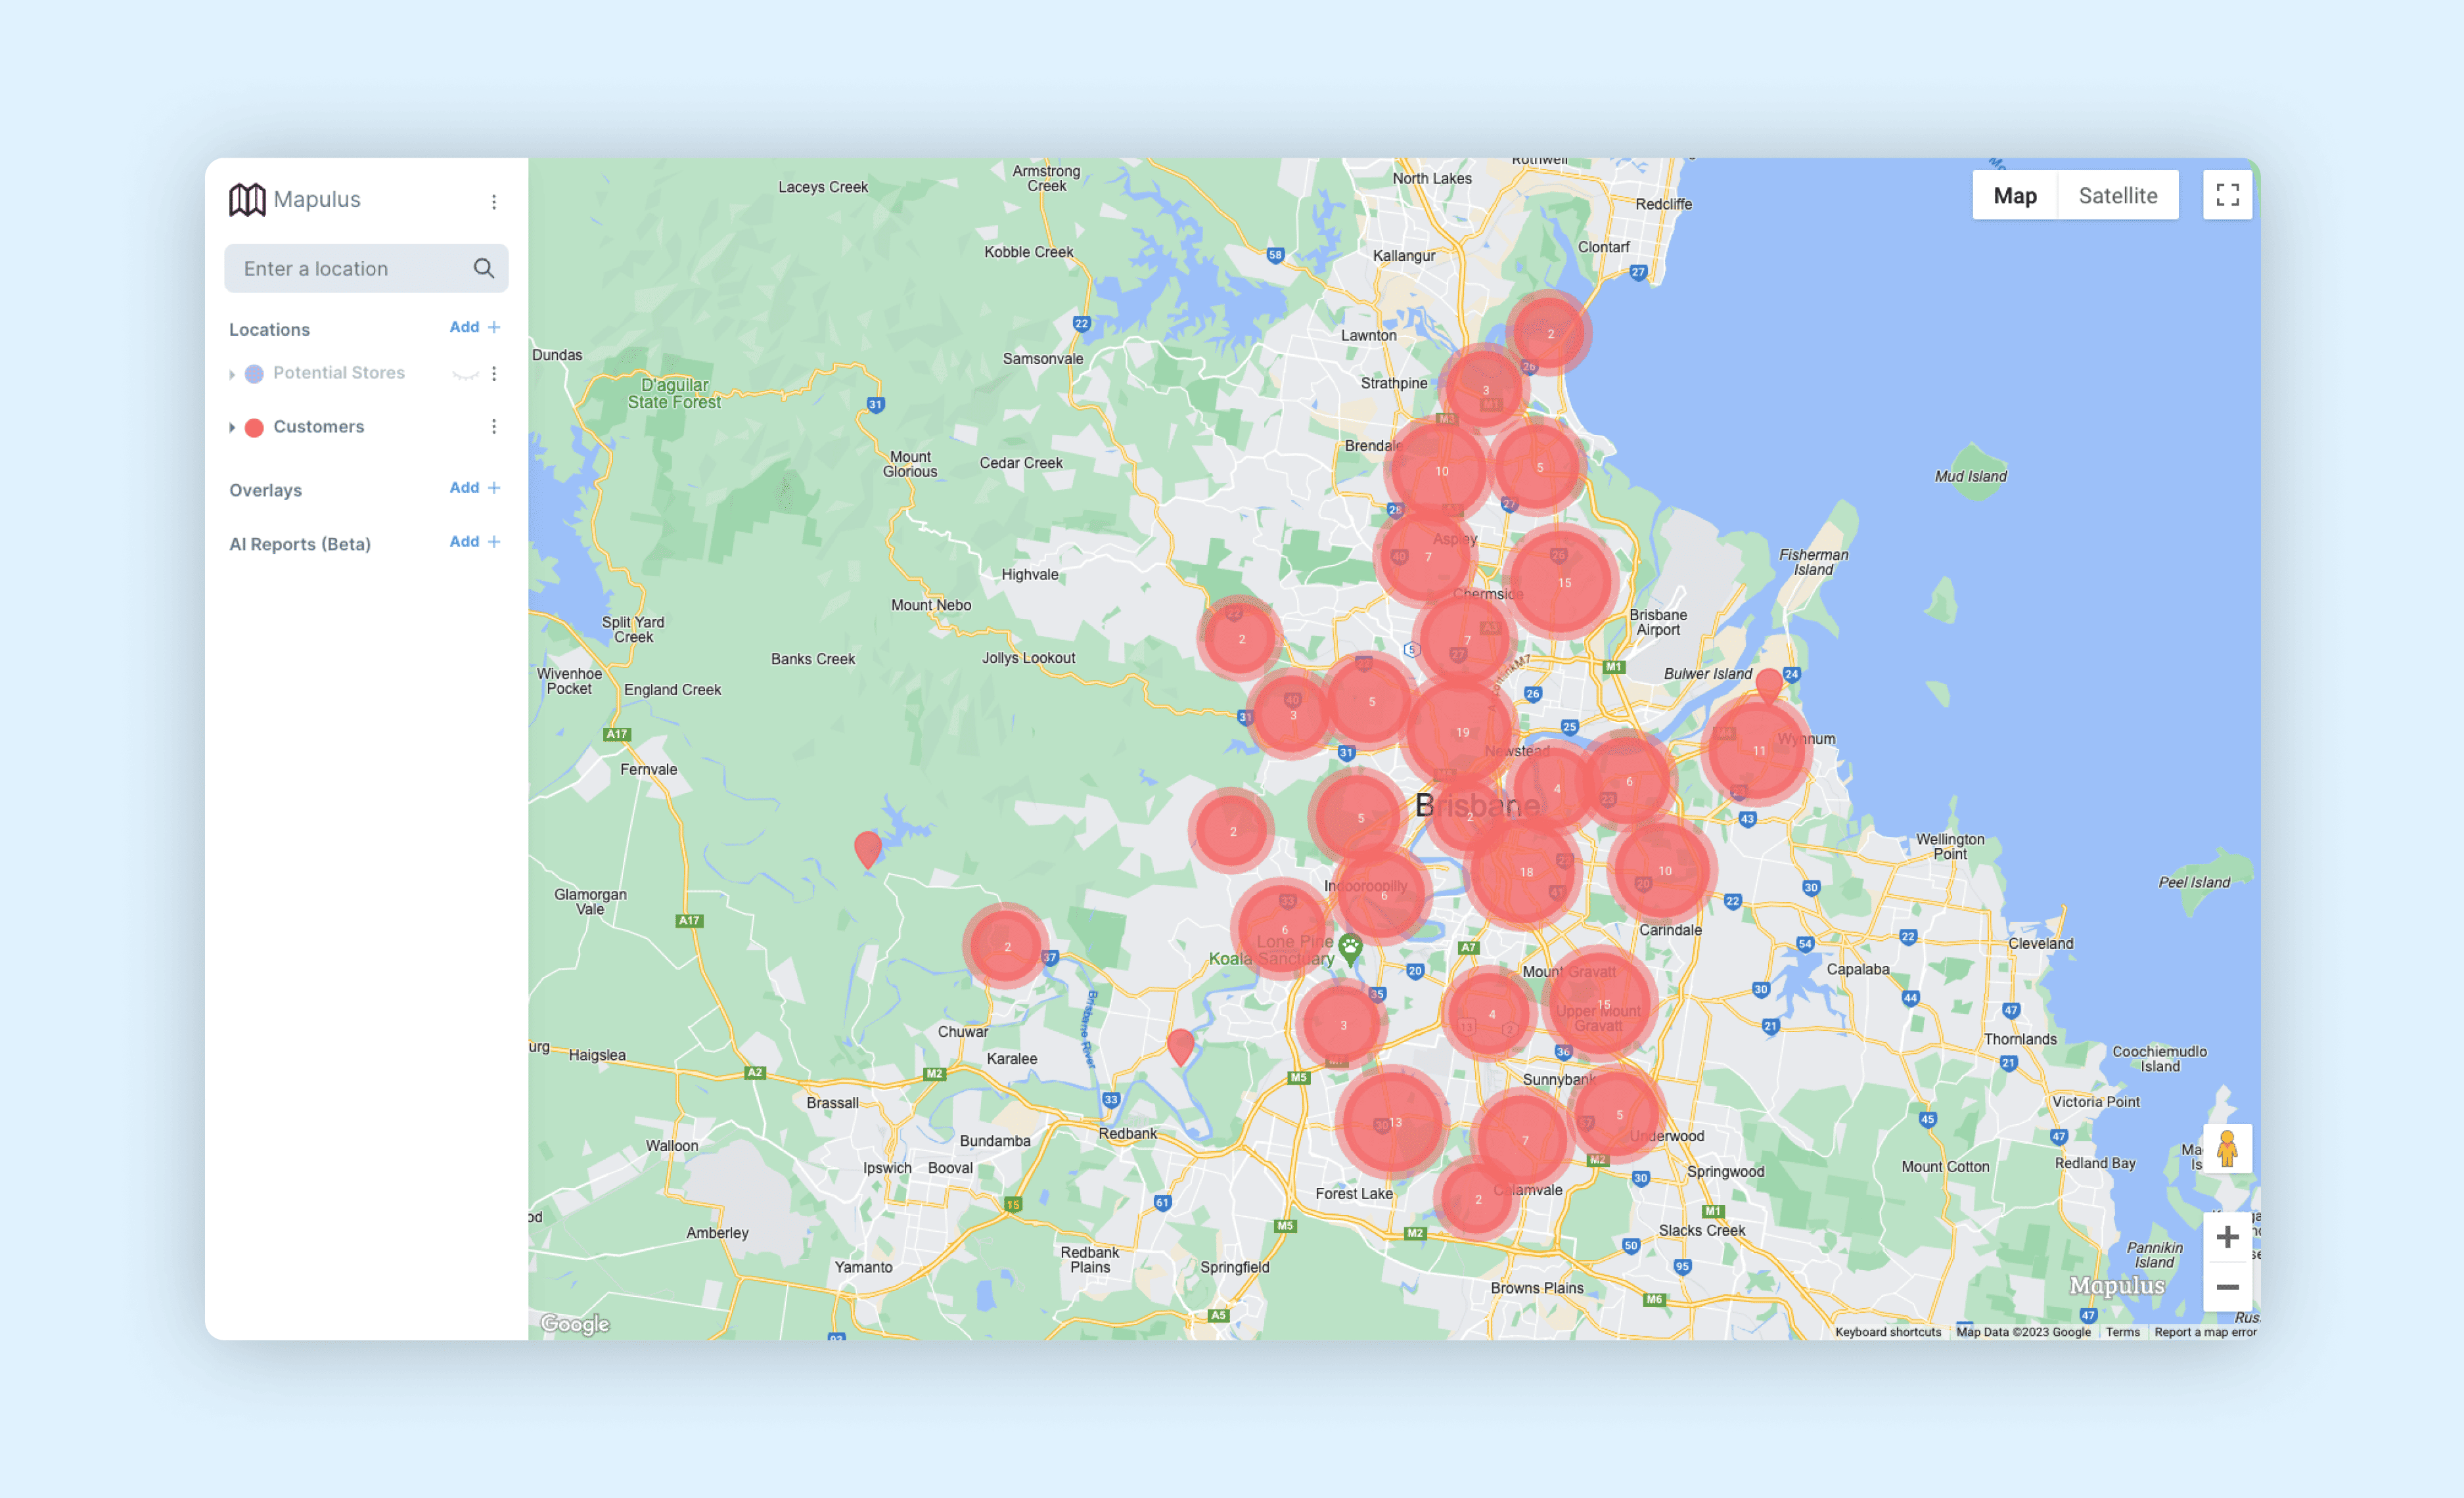
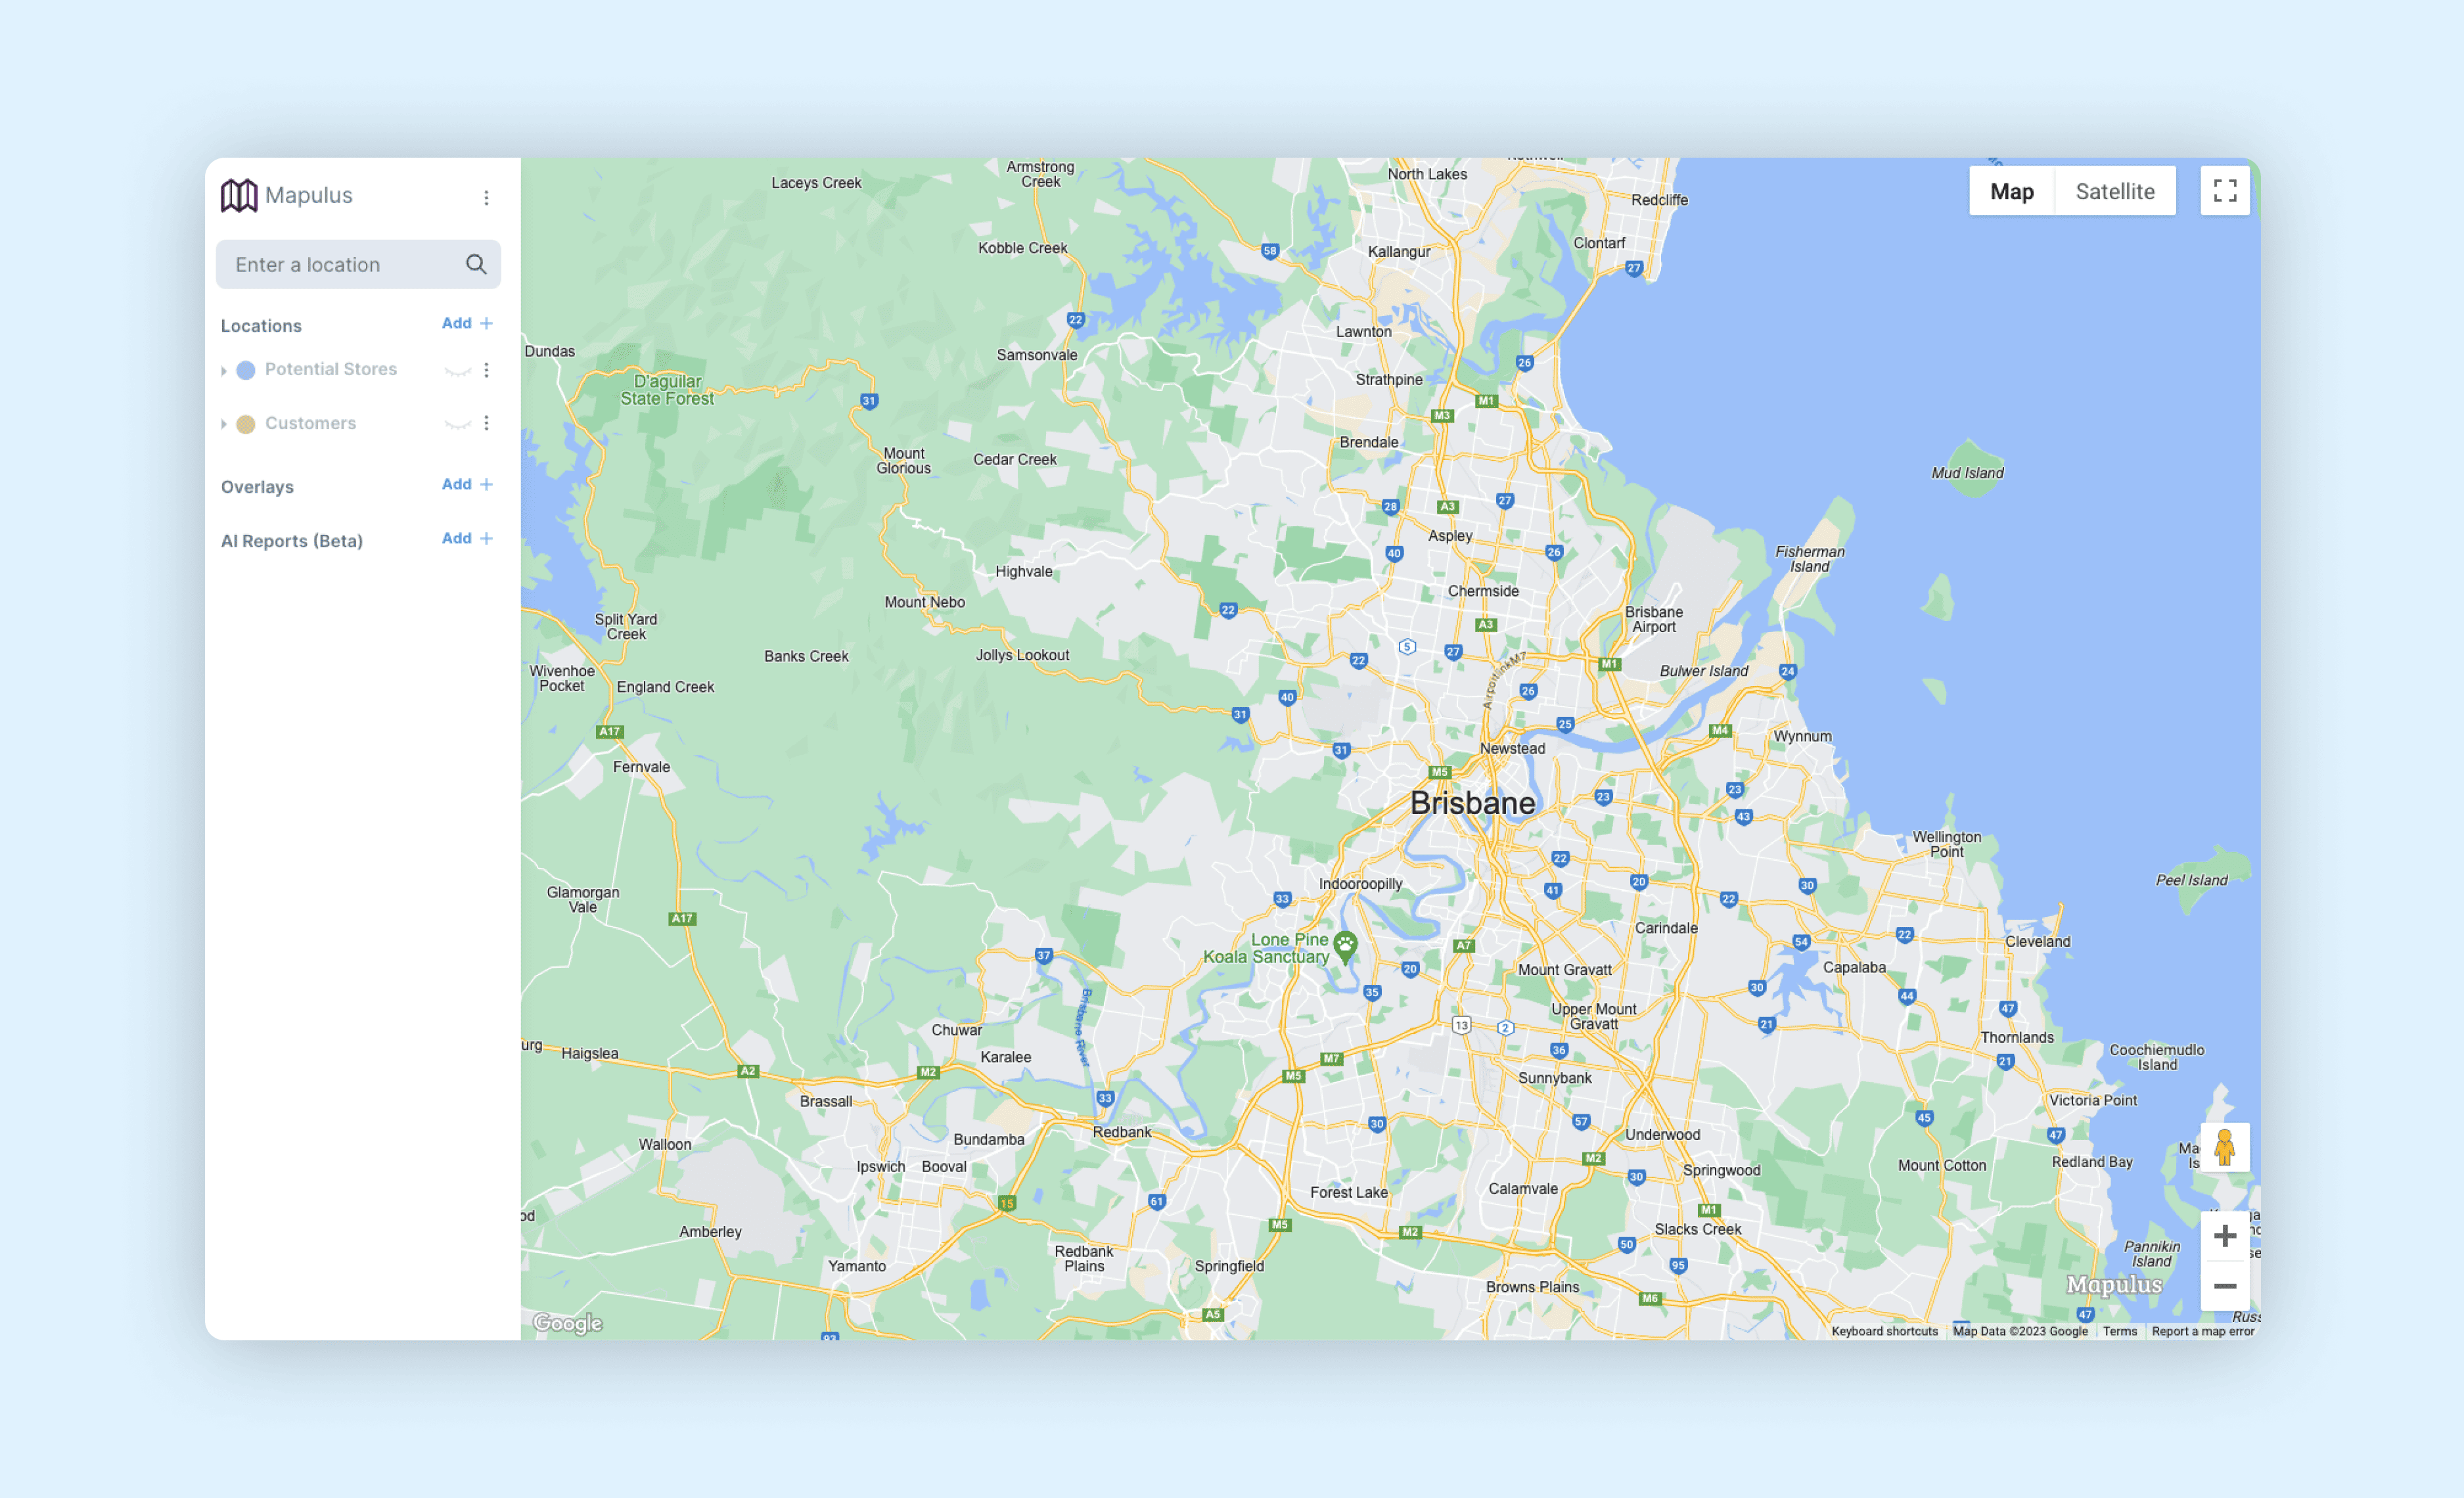
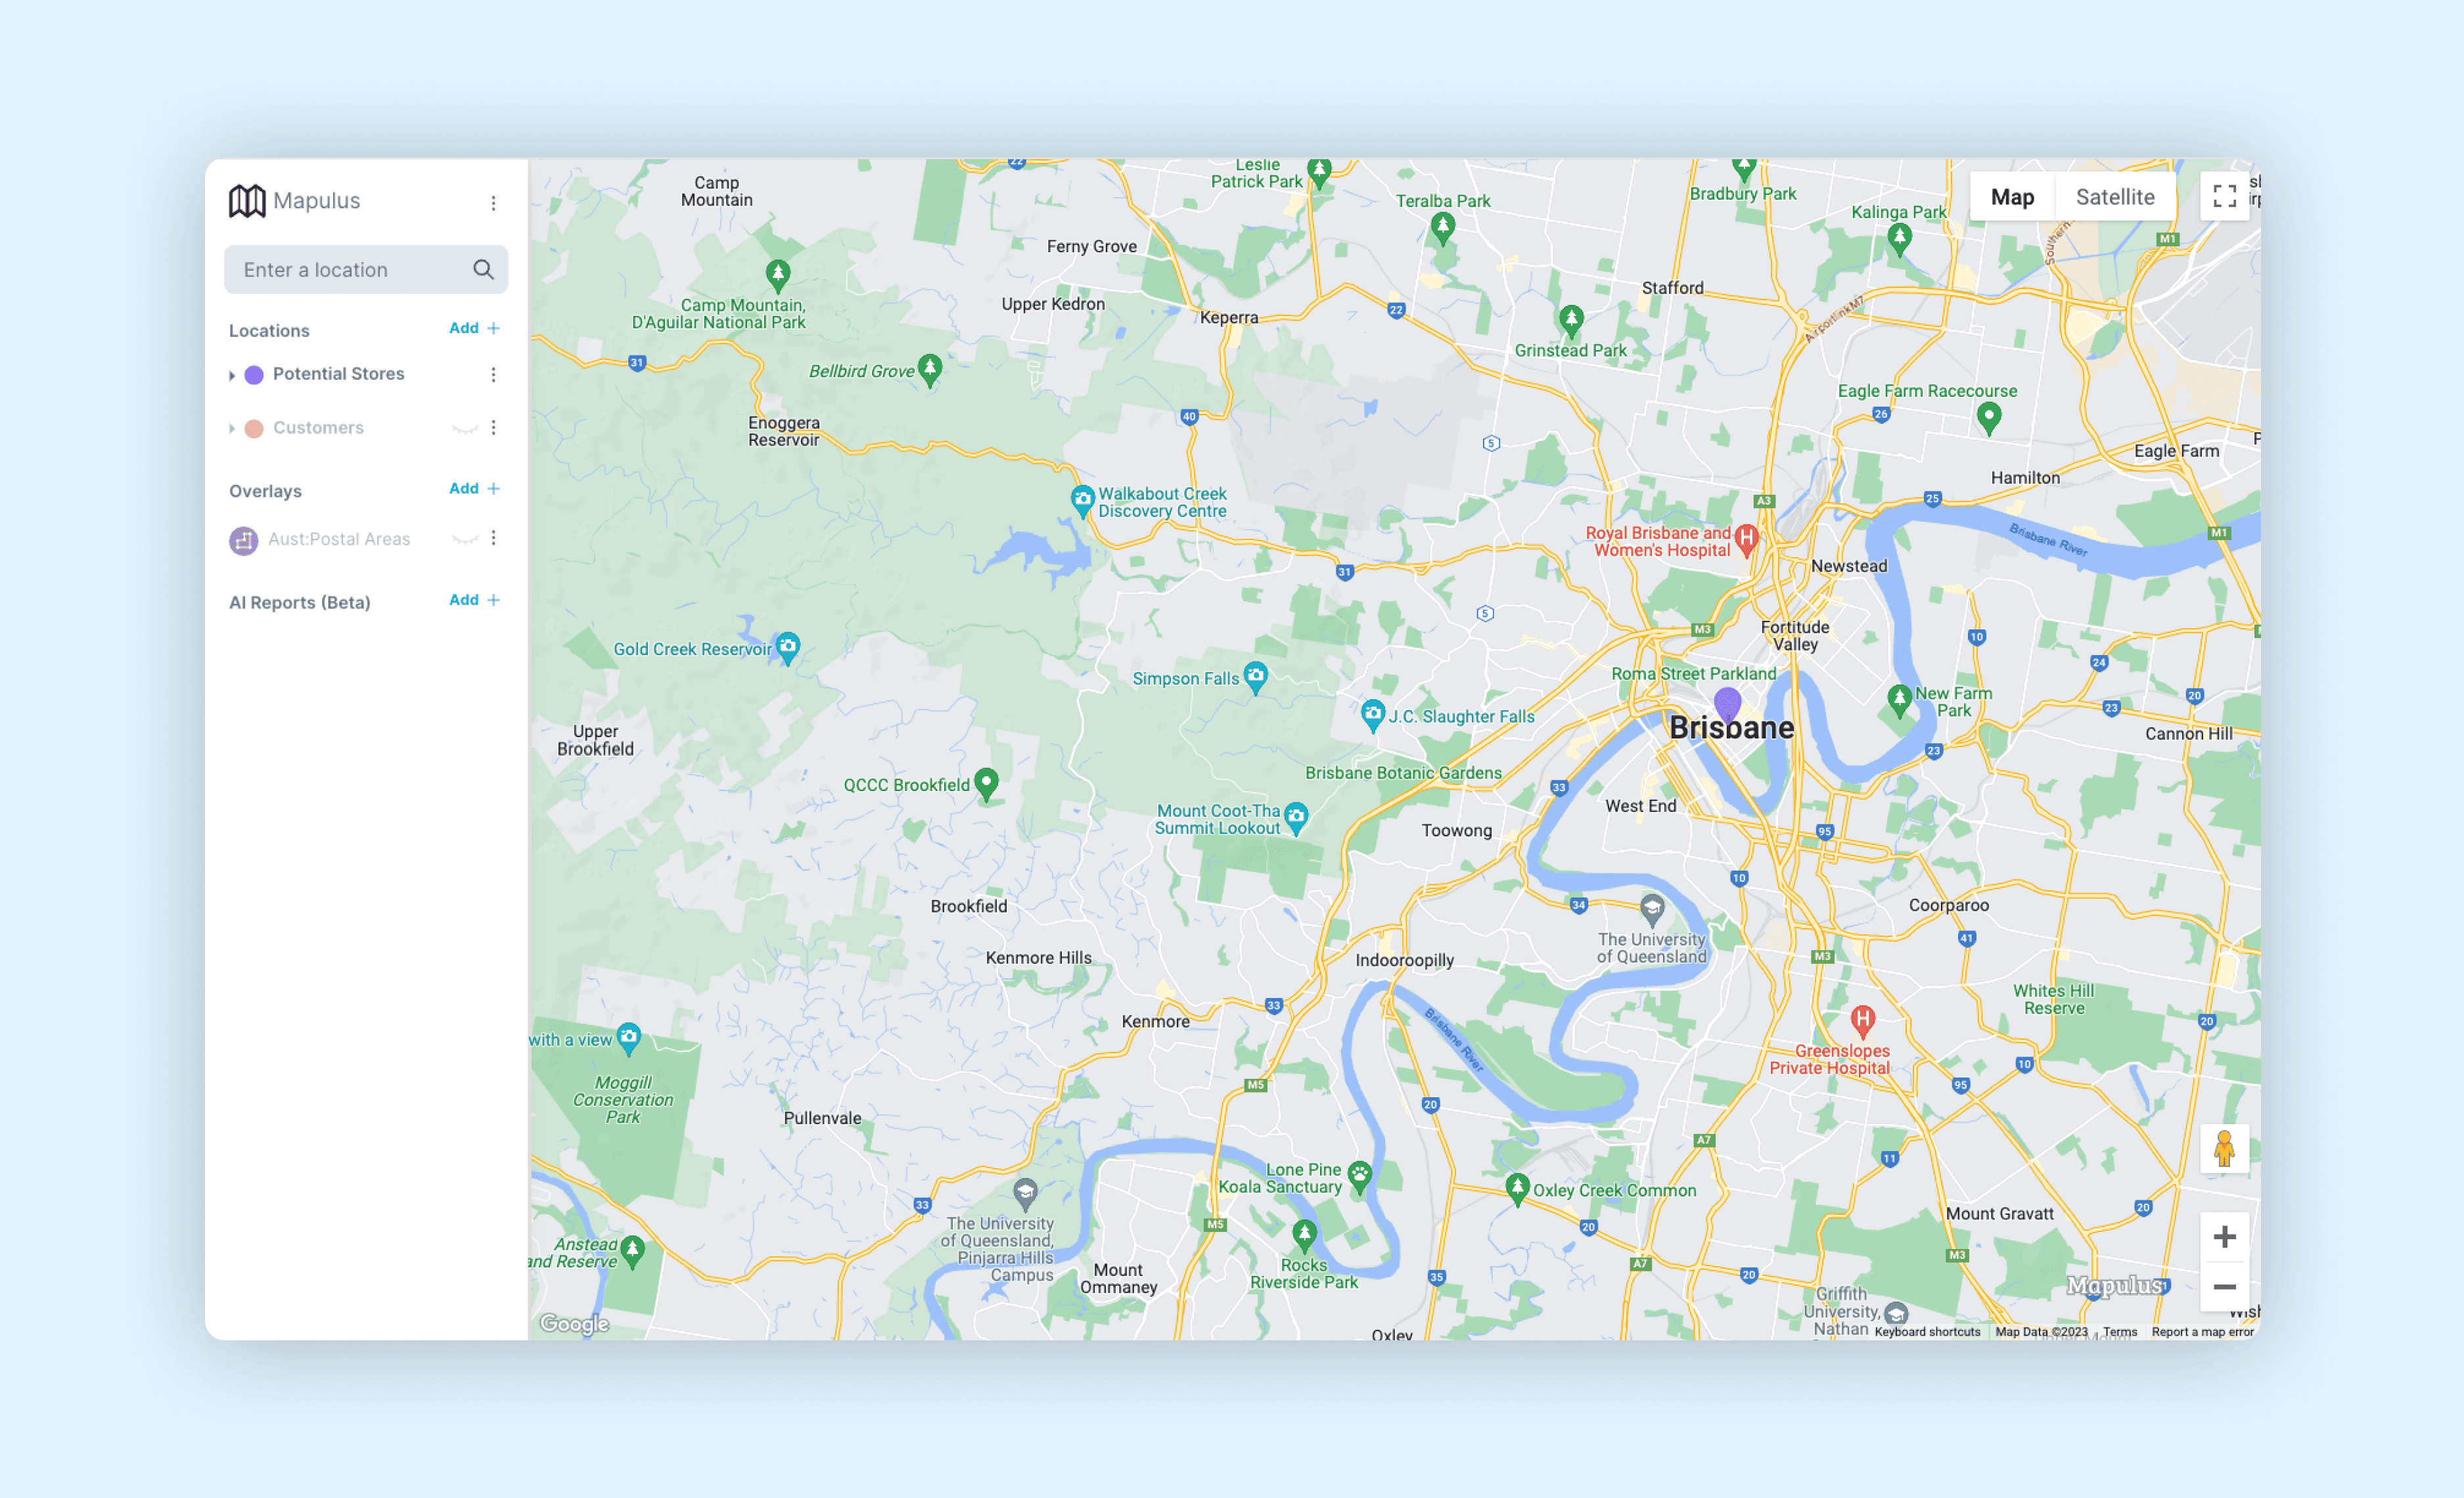
Effortlessly convert complex location data into vivid, interactive maps. Share location insights and market patterns seamlessly with your team. Everyone gets the context they need, whether you’re in sales, marketing, or logistics.
Go beyond the basics with enhanced mapping capabilities, enabling simultaneous visualisation of multiple locations for comprehensive comparisons and analysis.
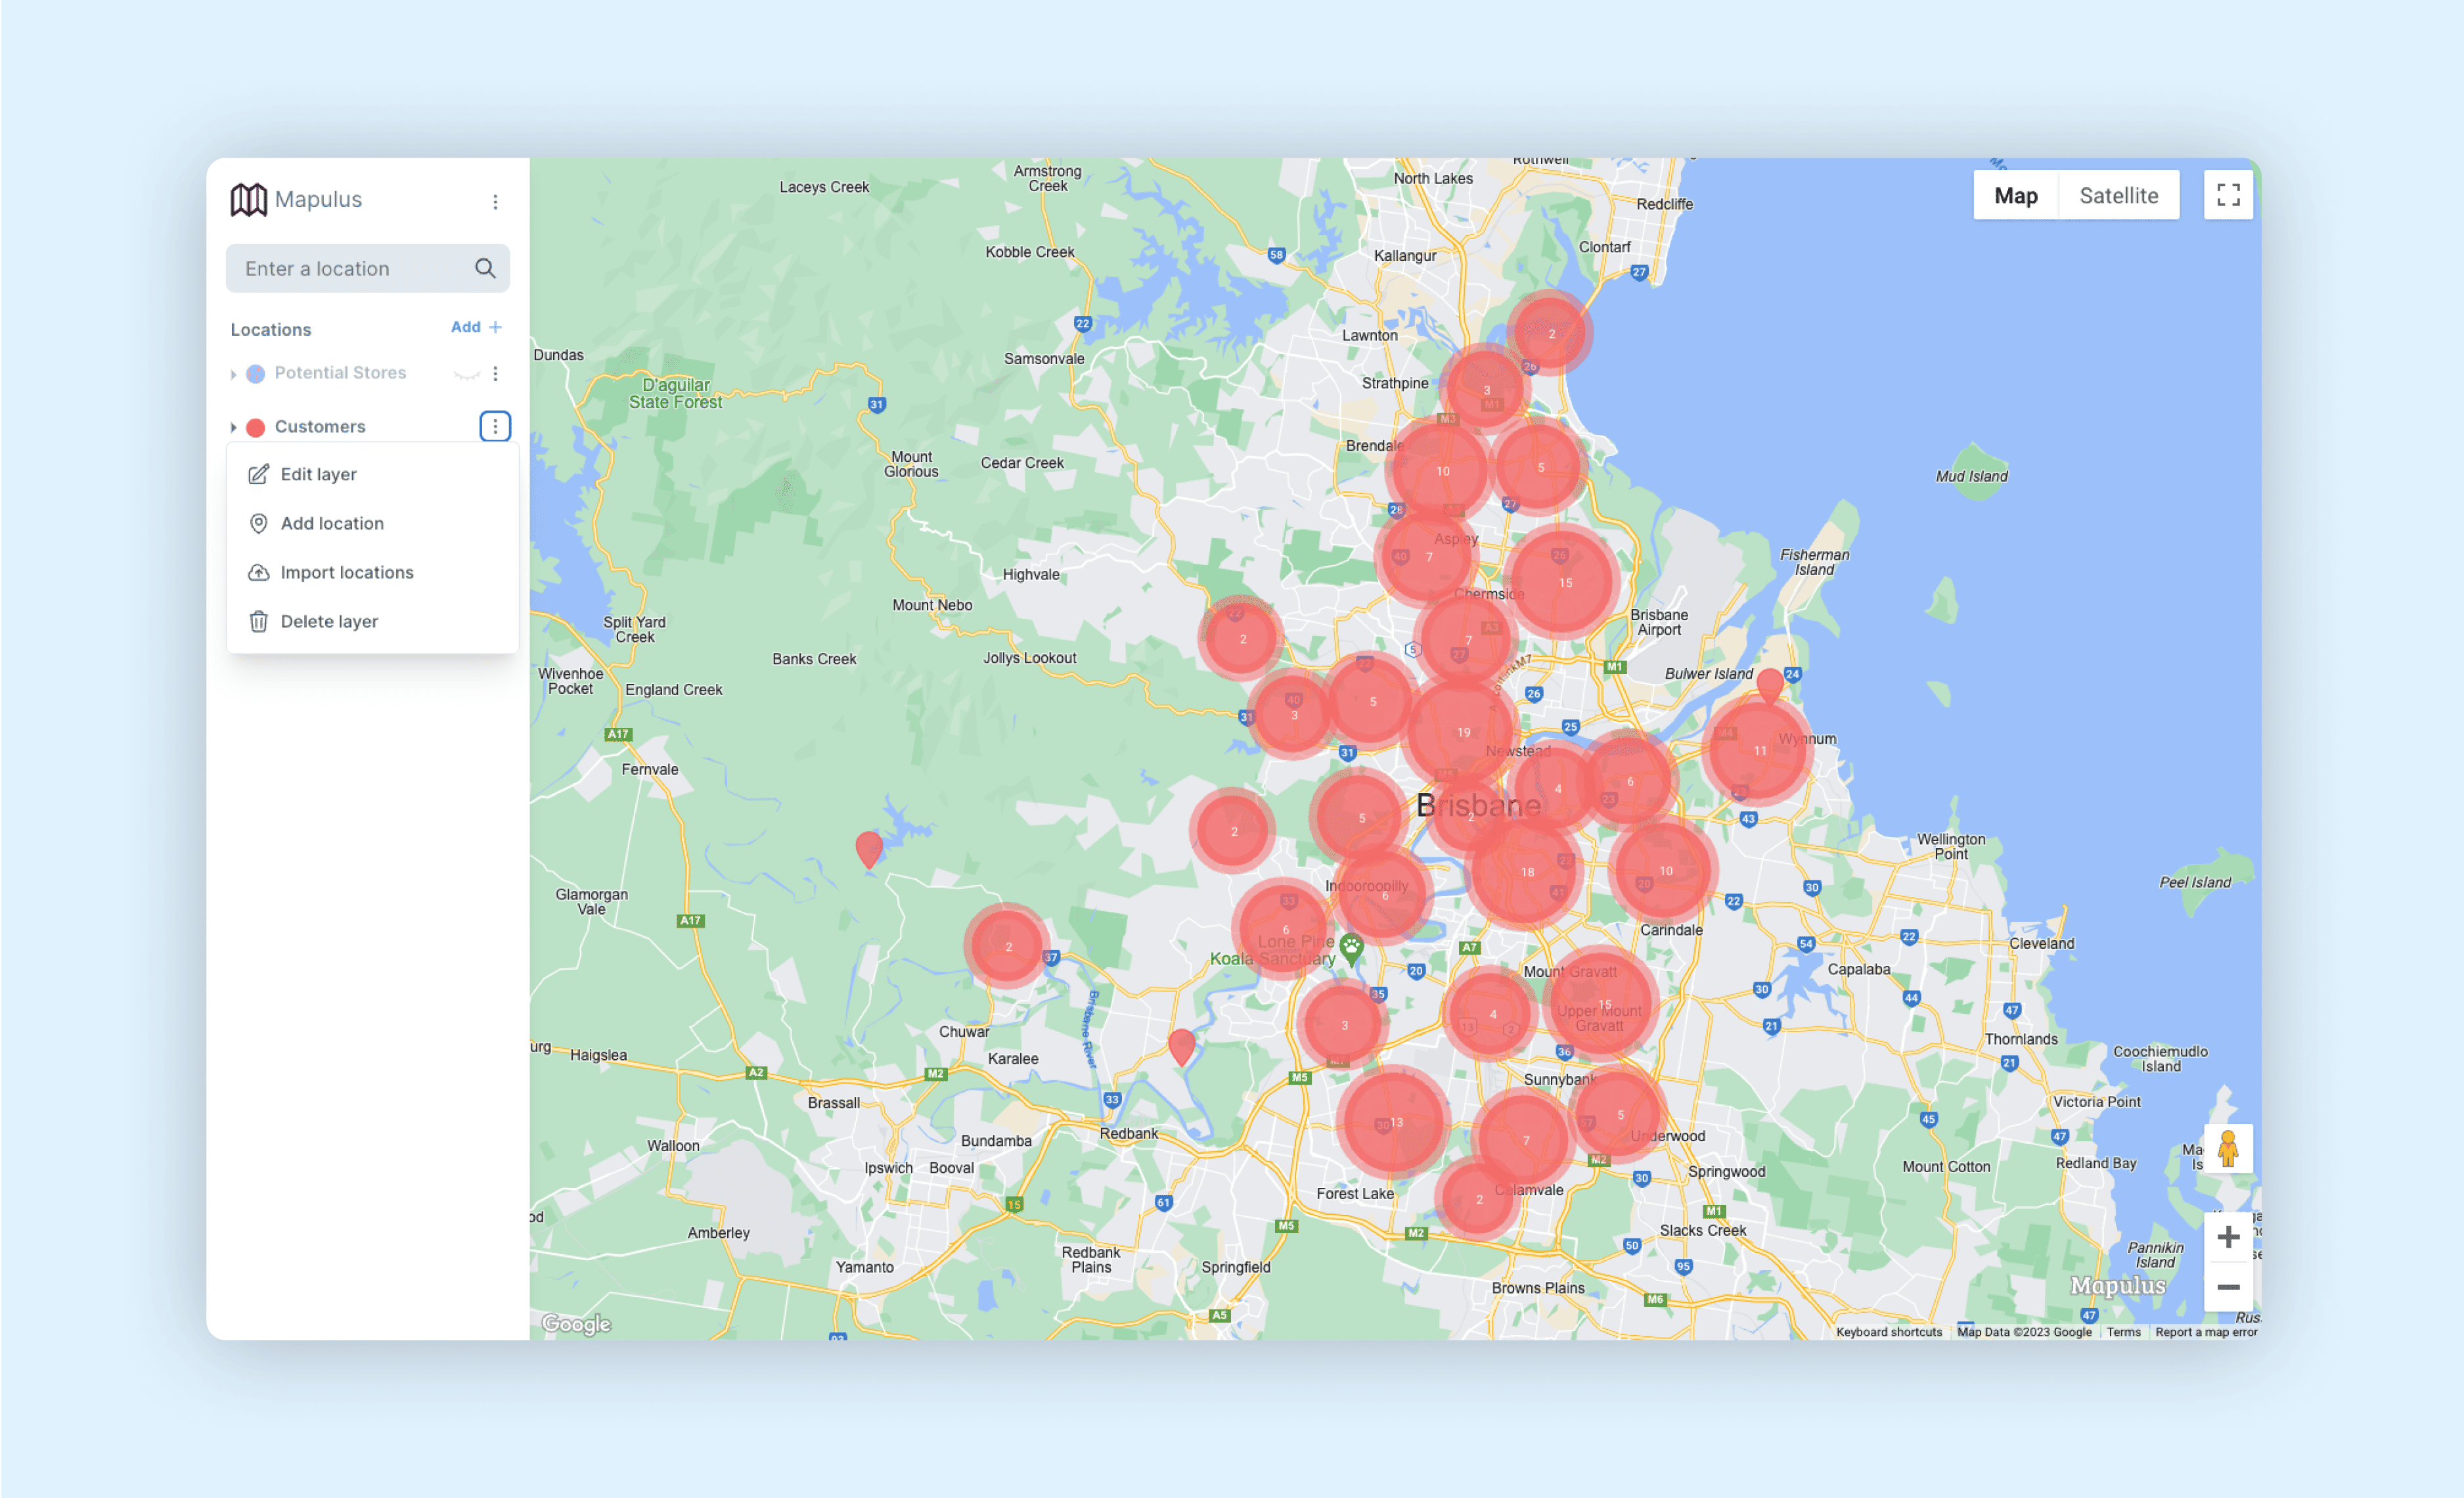
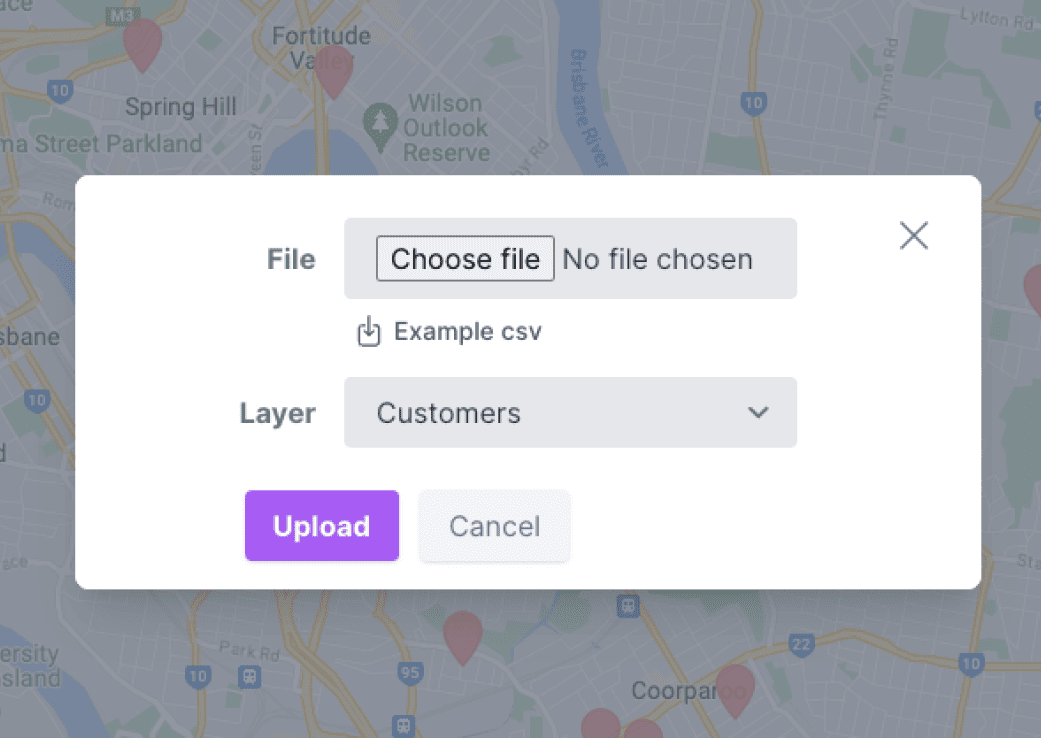
Simplify the data imports with bulk data uploads and seamless integration with your existing tools through our API and Zapier integration.
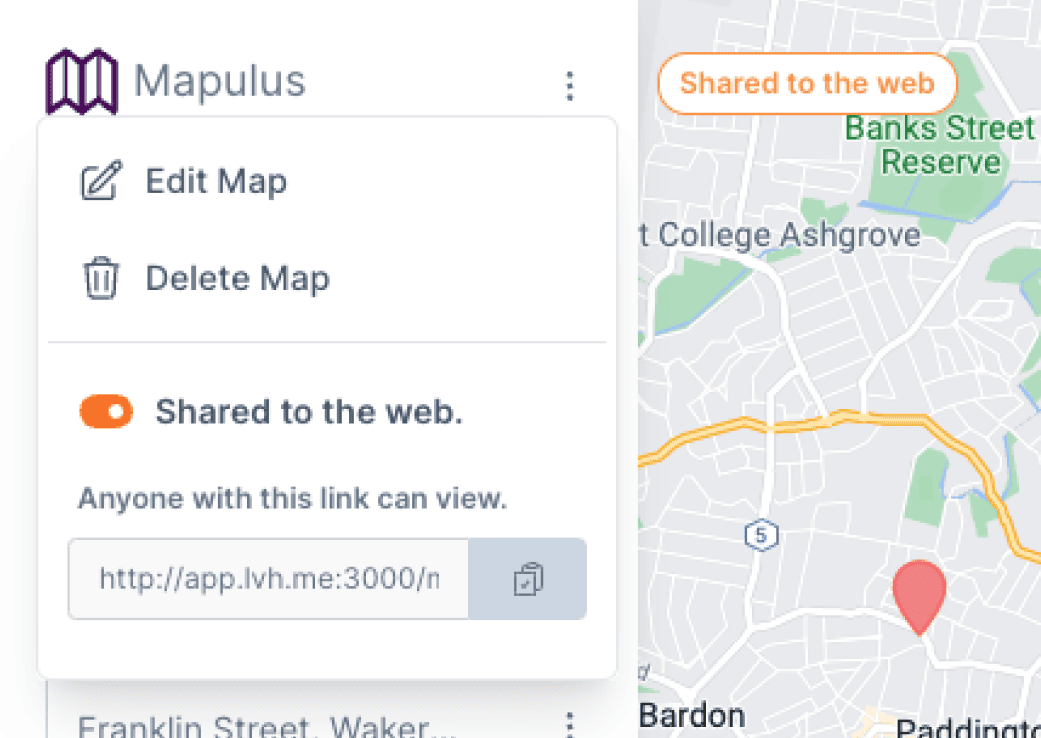
Foster collaboration with easy-to-use team features. Share maps effortlessly, ensuring every team member, regardless of their department, is on the same page.
Efficiently designate and manage territories across Australia. Whether you want to optimise sales regions, distribution zones, or service areas, our platform provides the necessary tools and insights.
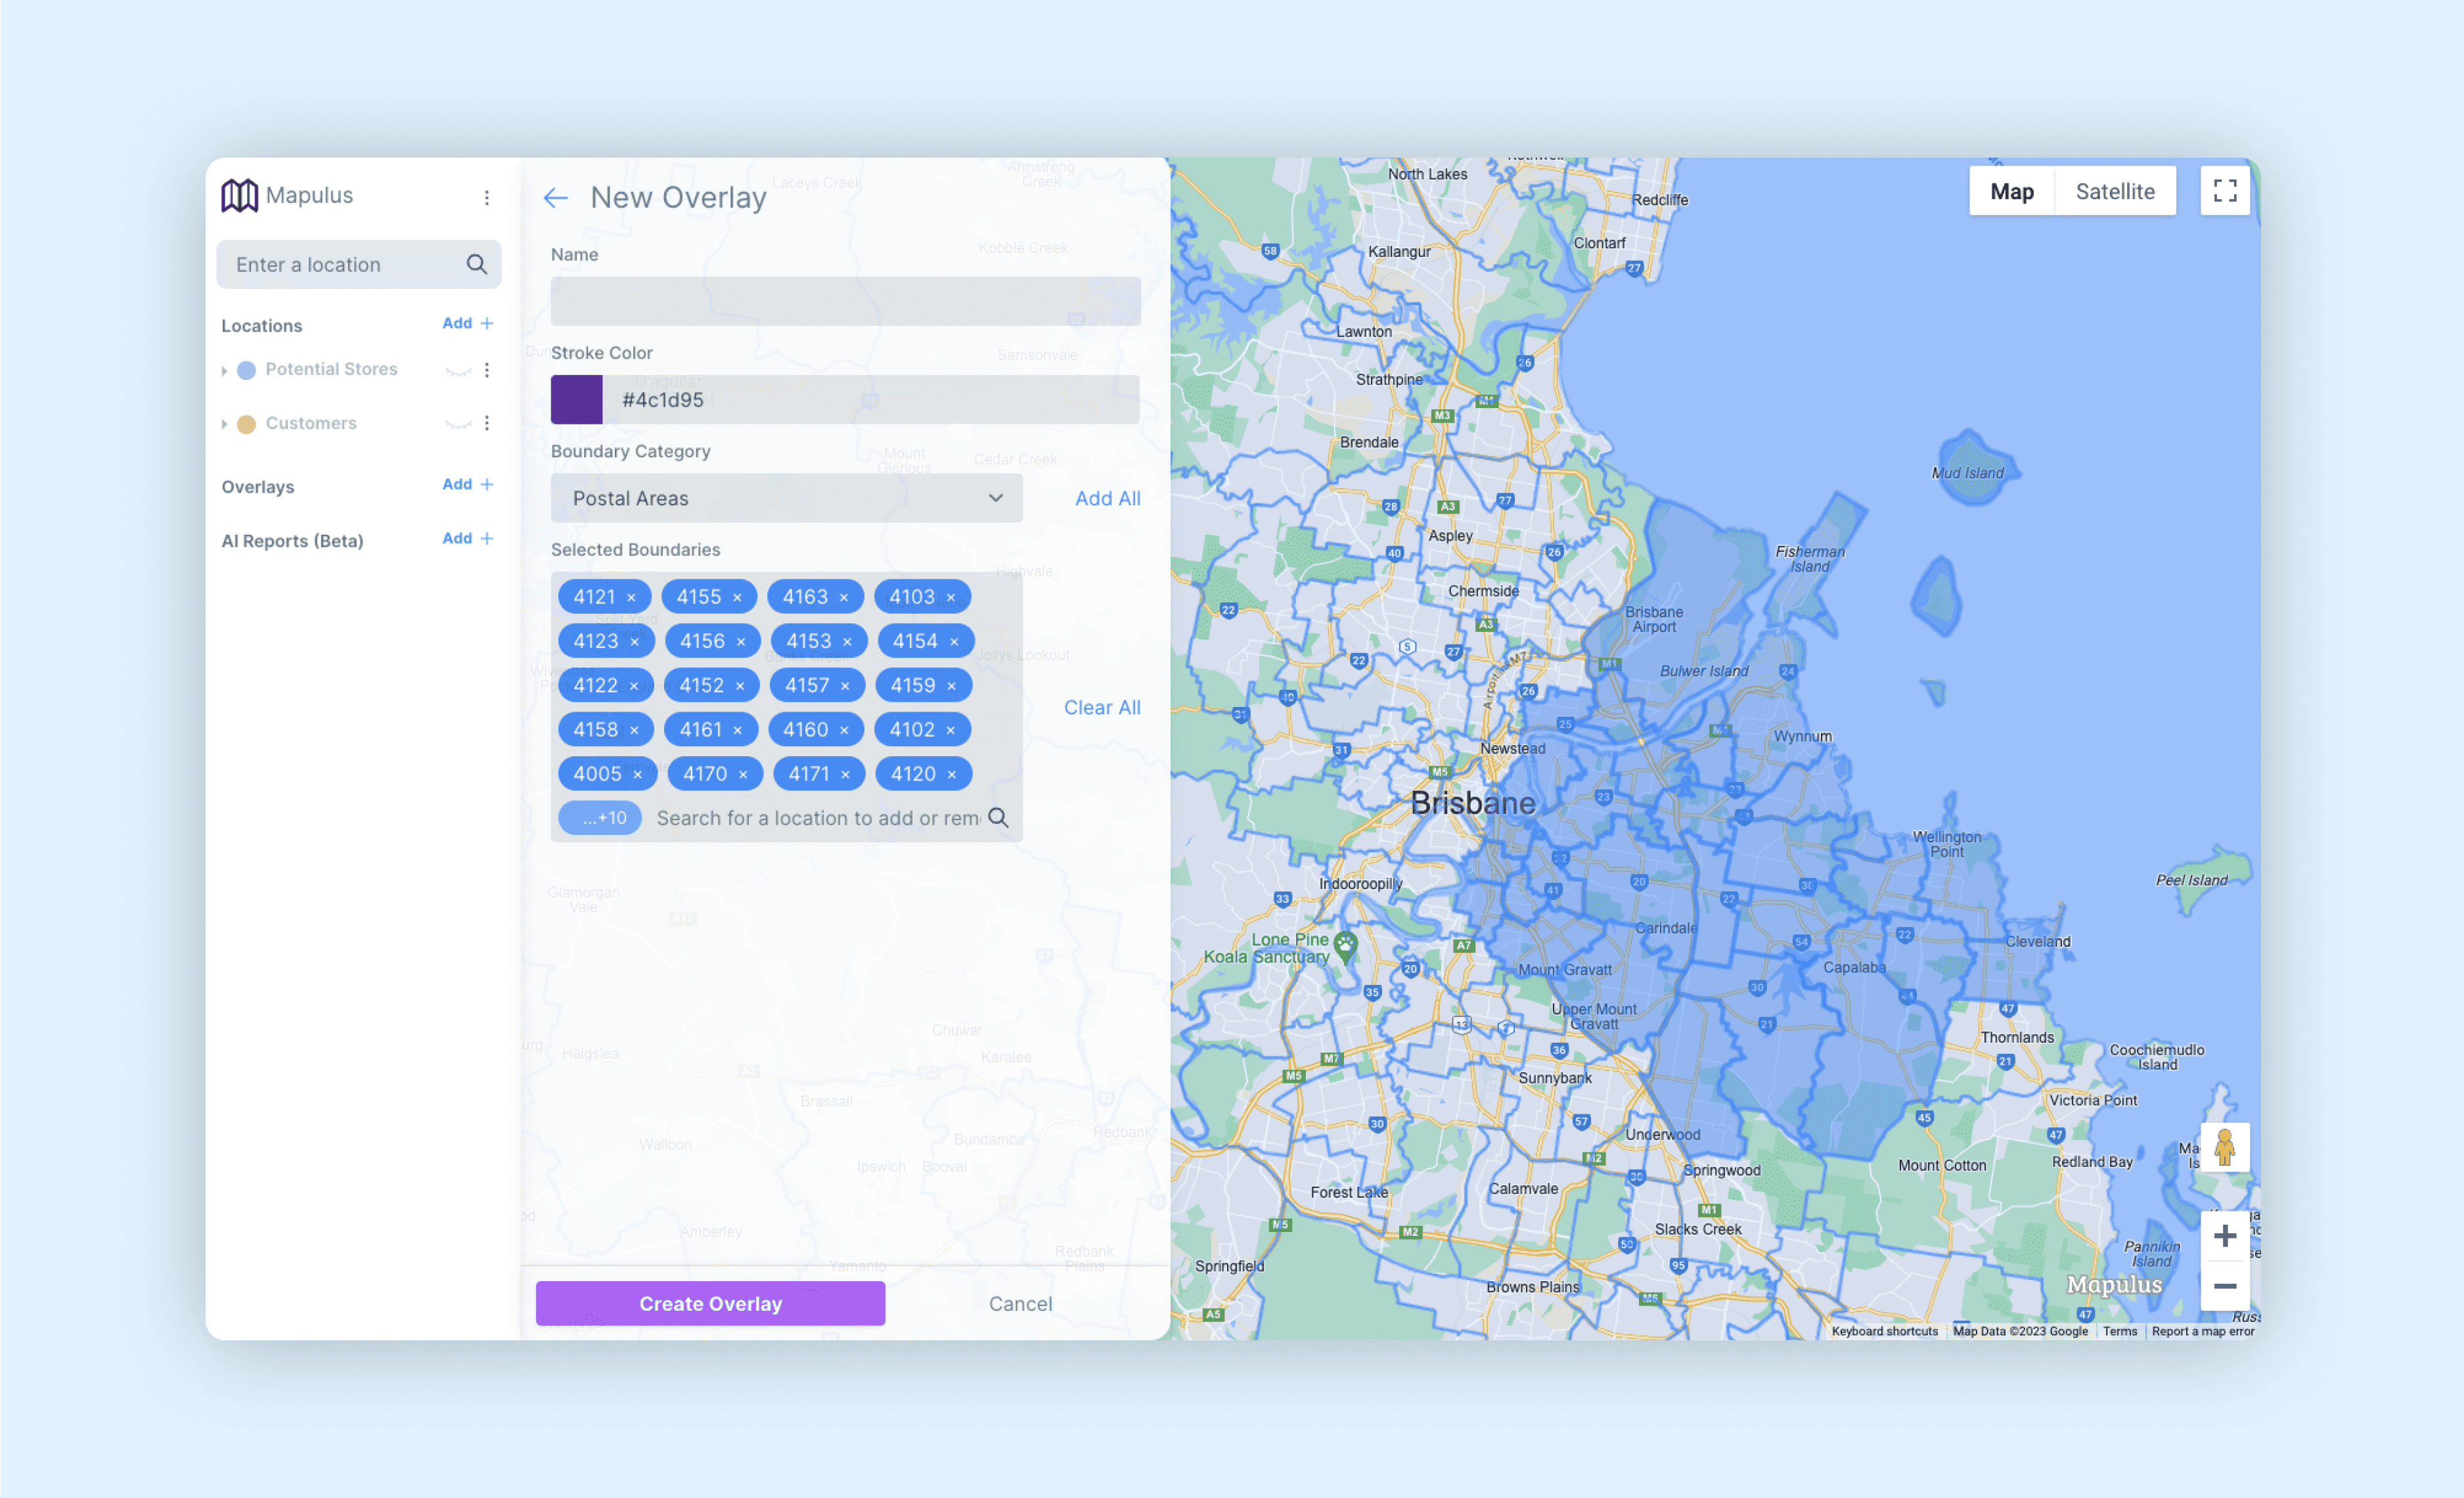
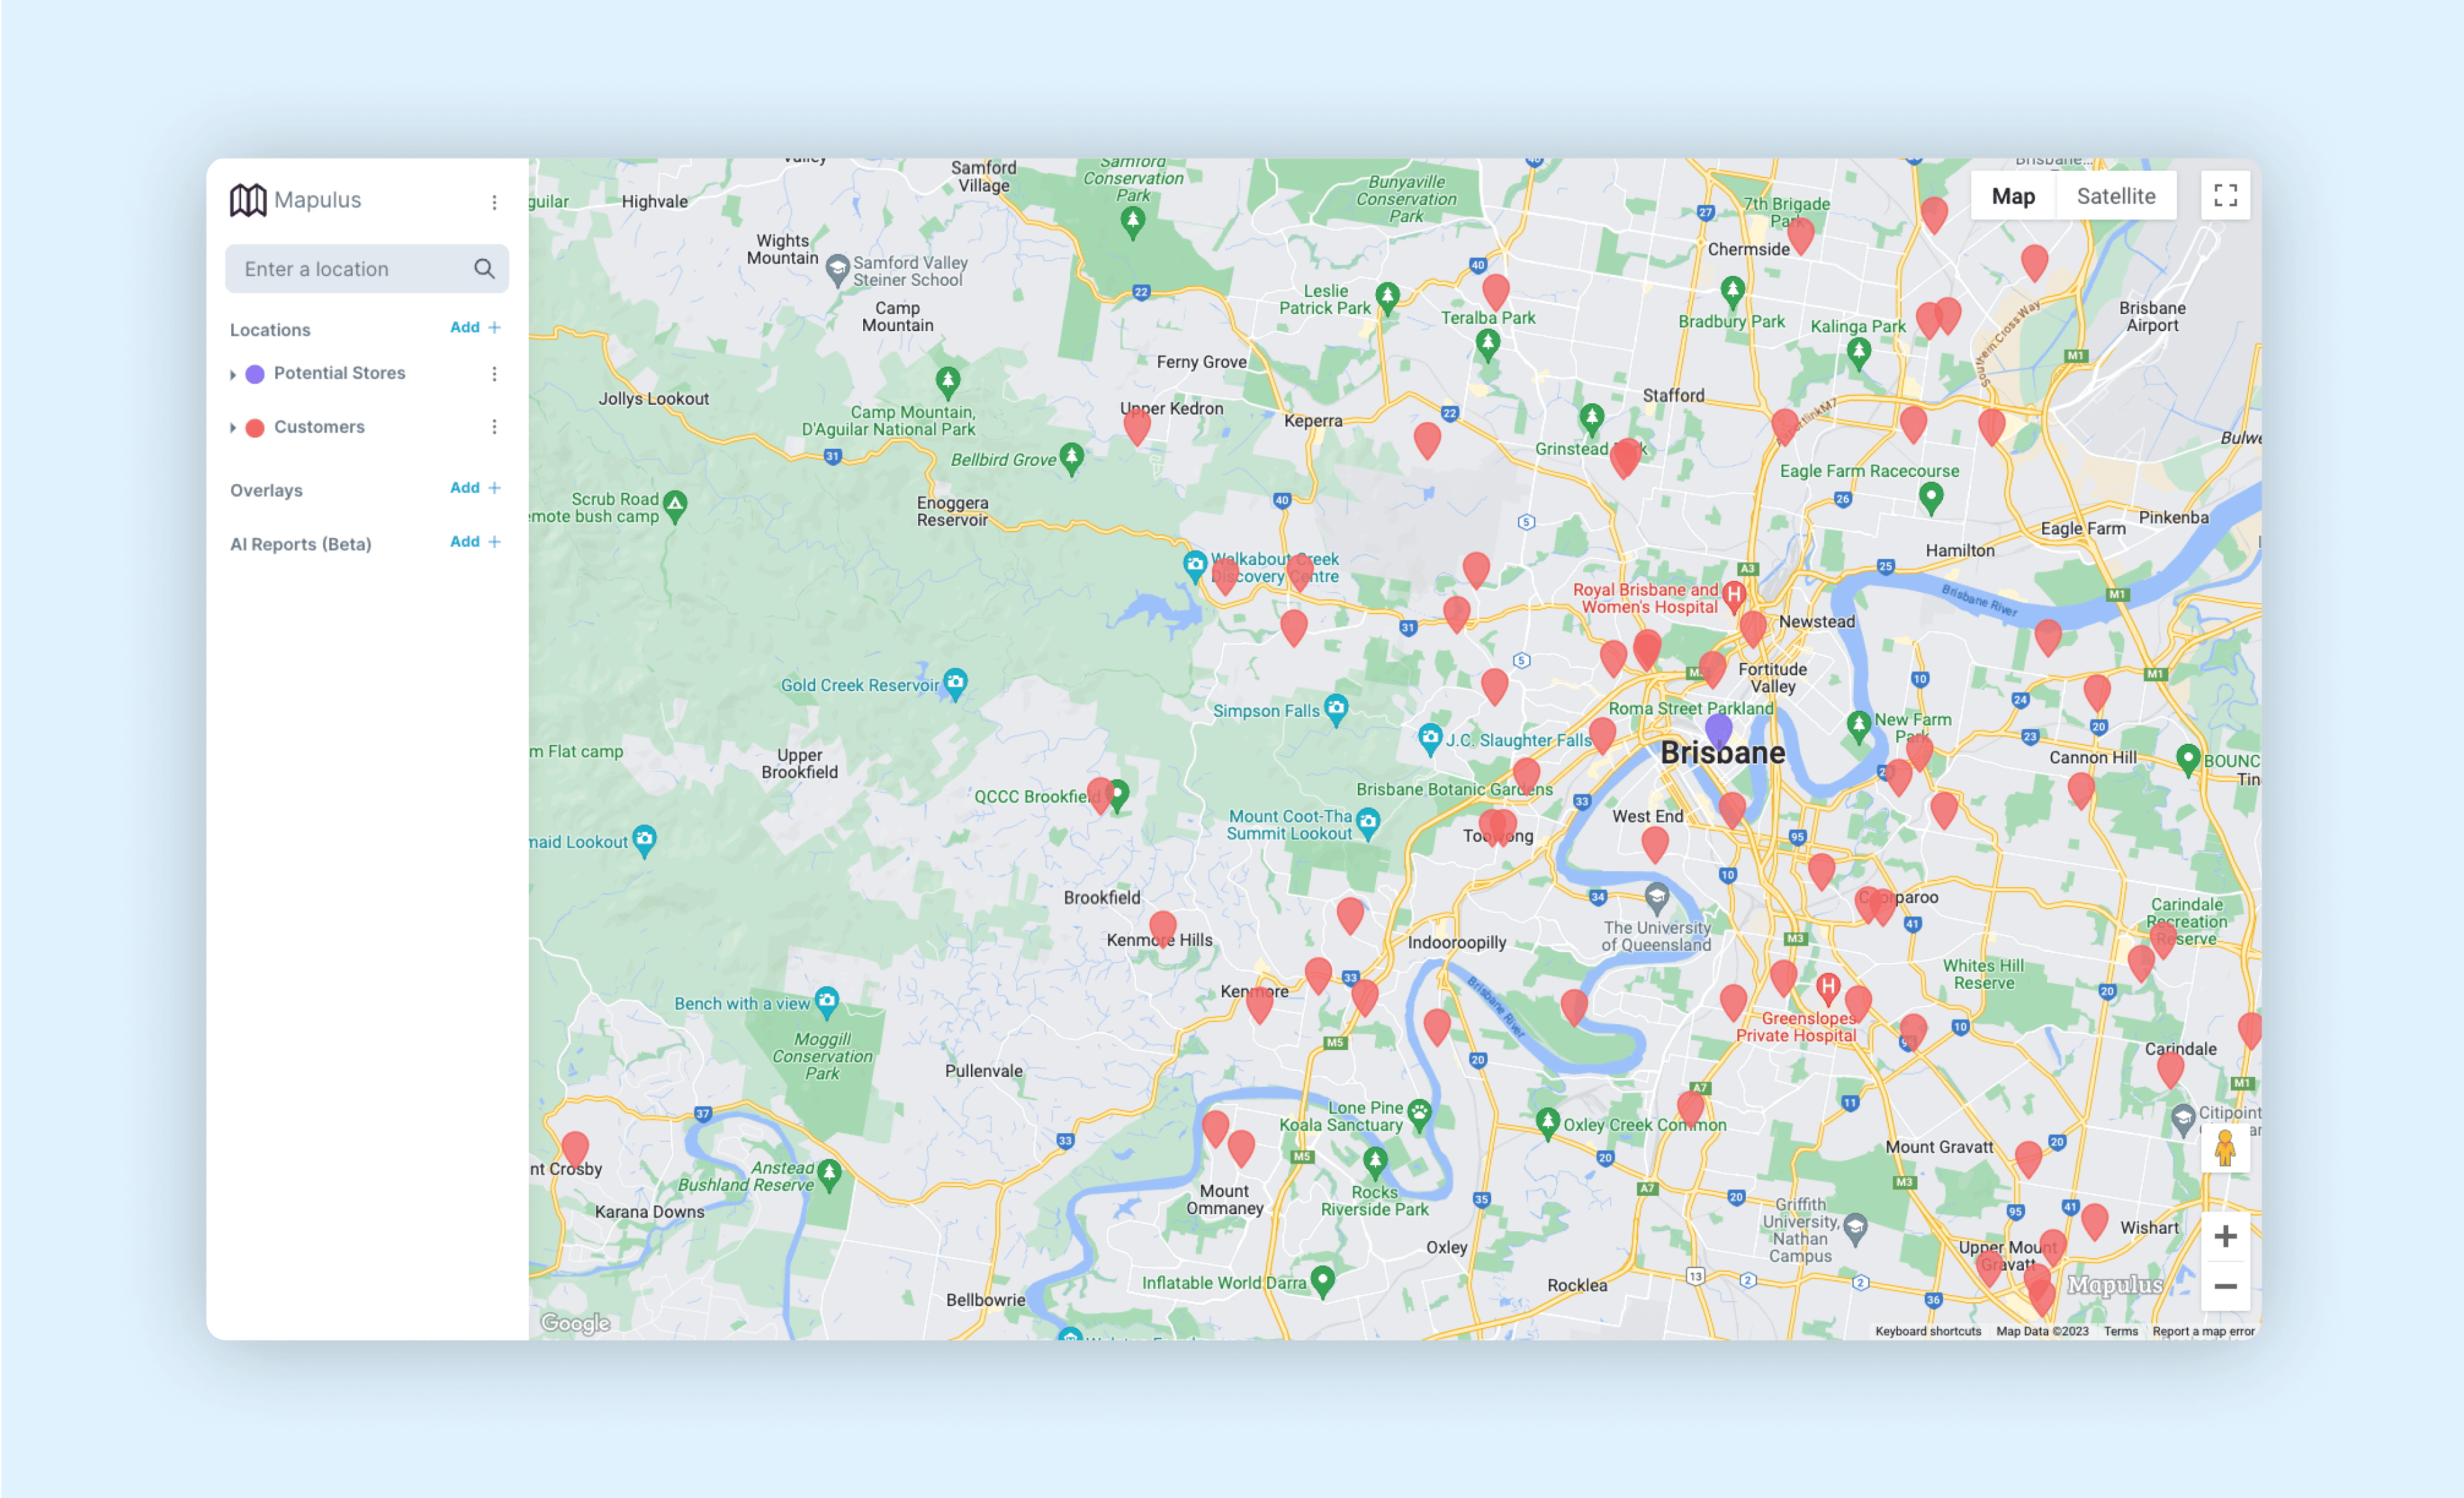
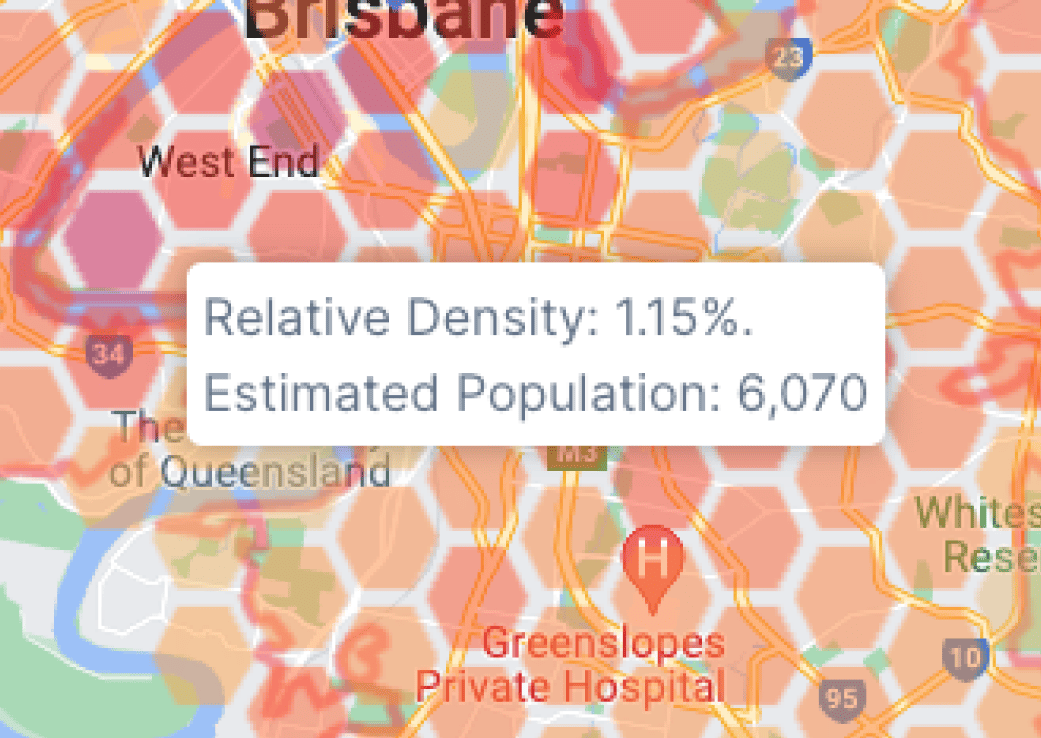
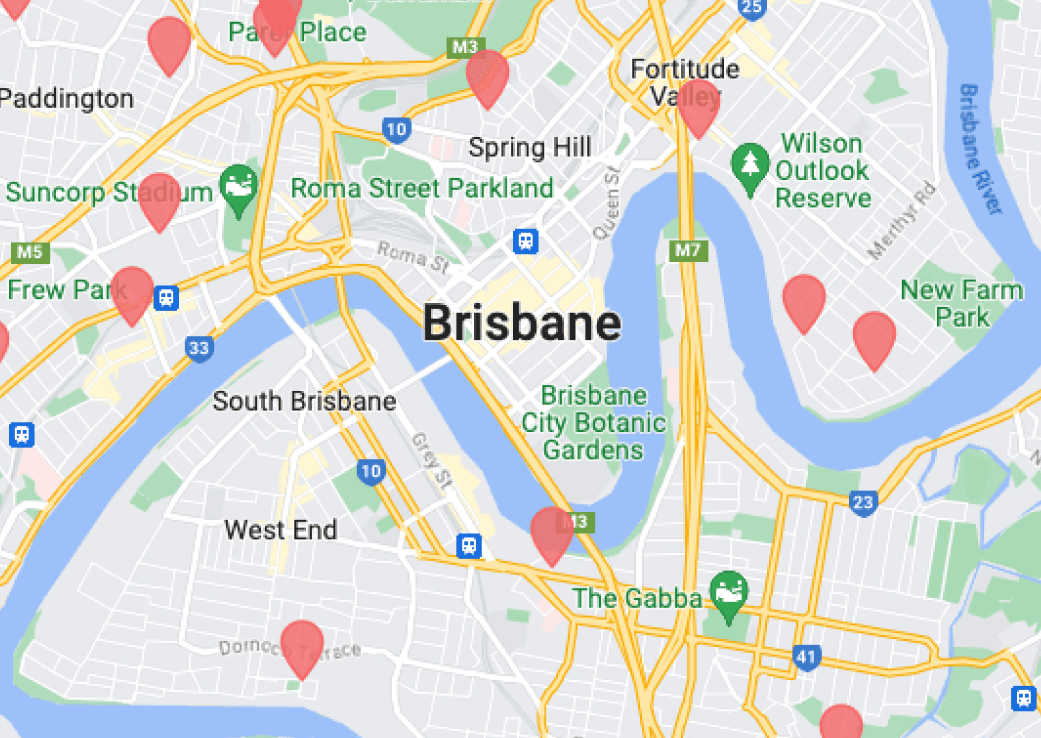
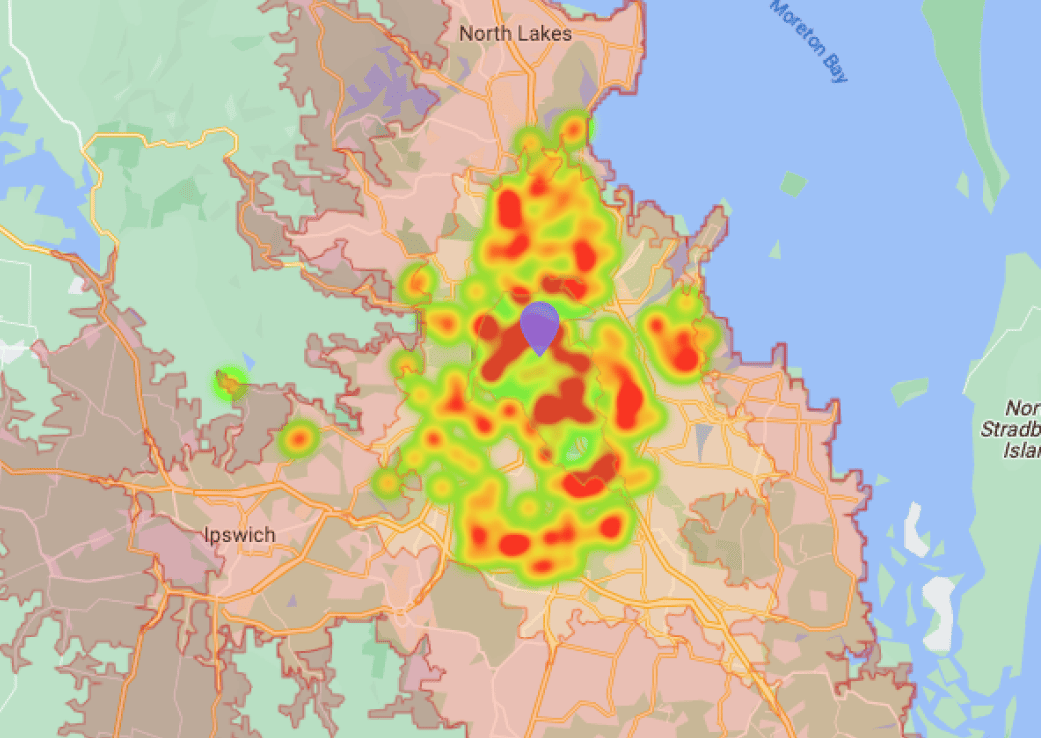
Perfect for businesses that need to segment their delivery, sales, or service territories. Visualise the volume and type of customers within a postcode, ensuring efficient route planning and targeted campaigns.
Ideal for those in the political or community engagement sector. Understand and visualise voter distribution and demographics to strategise your campaigns.
For businesses that rely heavily on data analytics, mapping out and understanding areas based on statistical Australian Bureau of Statistics (ABS) information can be invaluable.
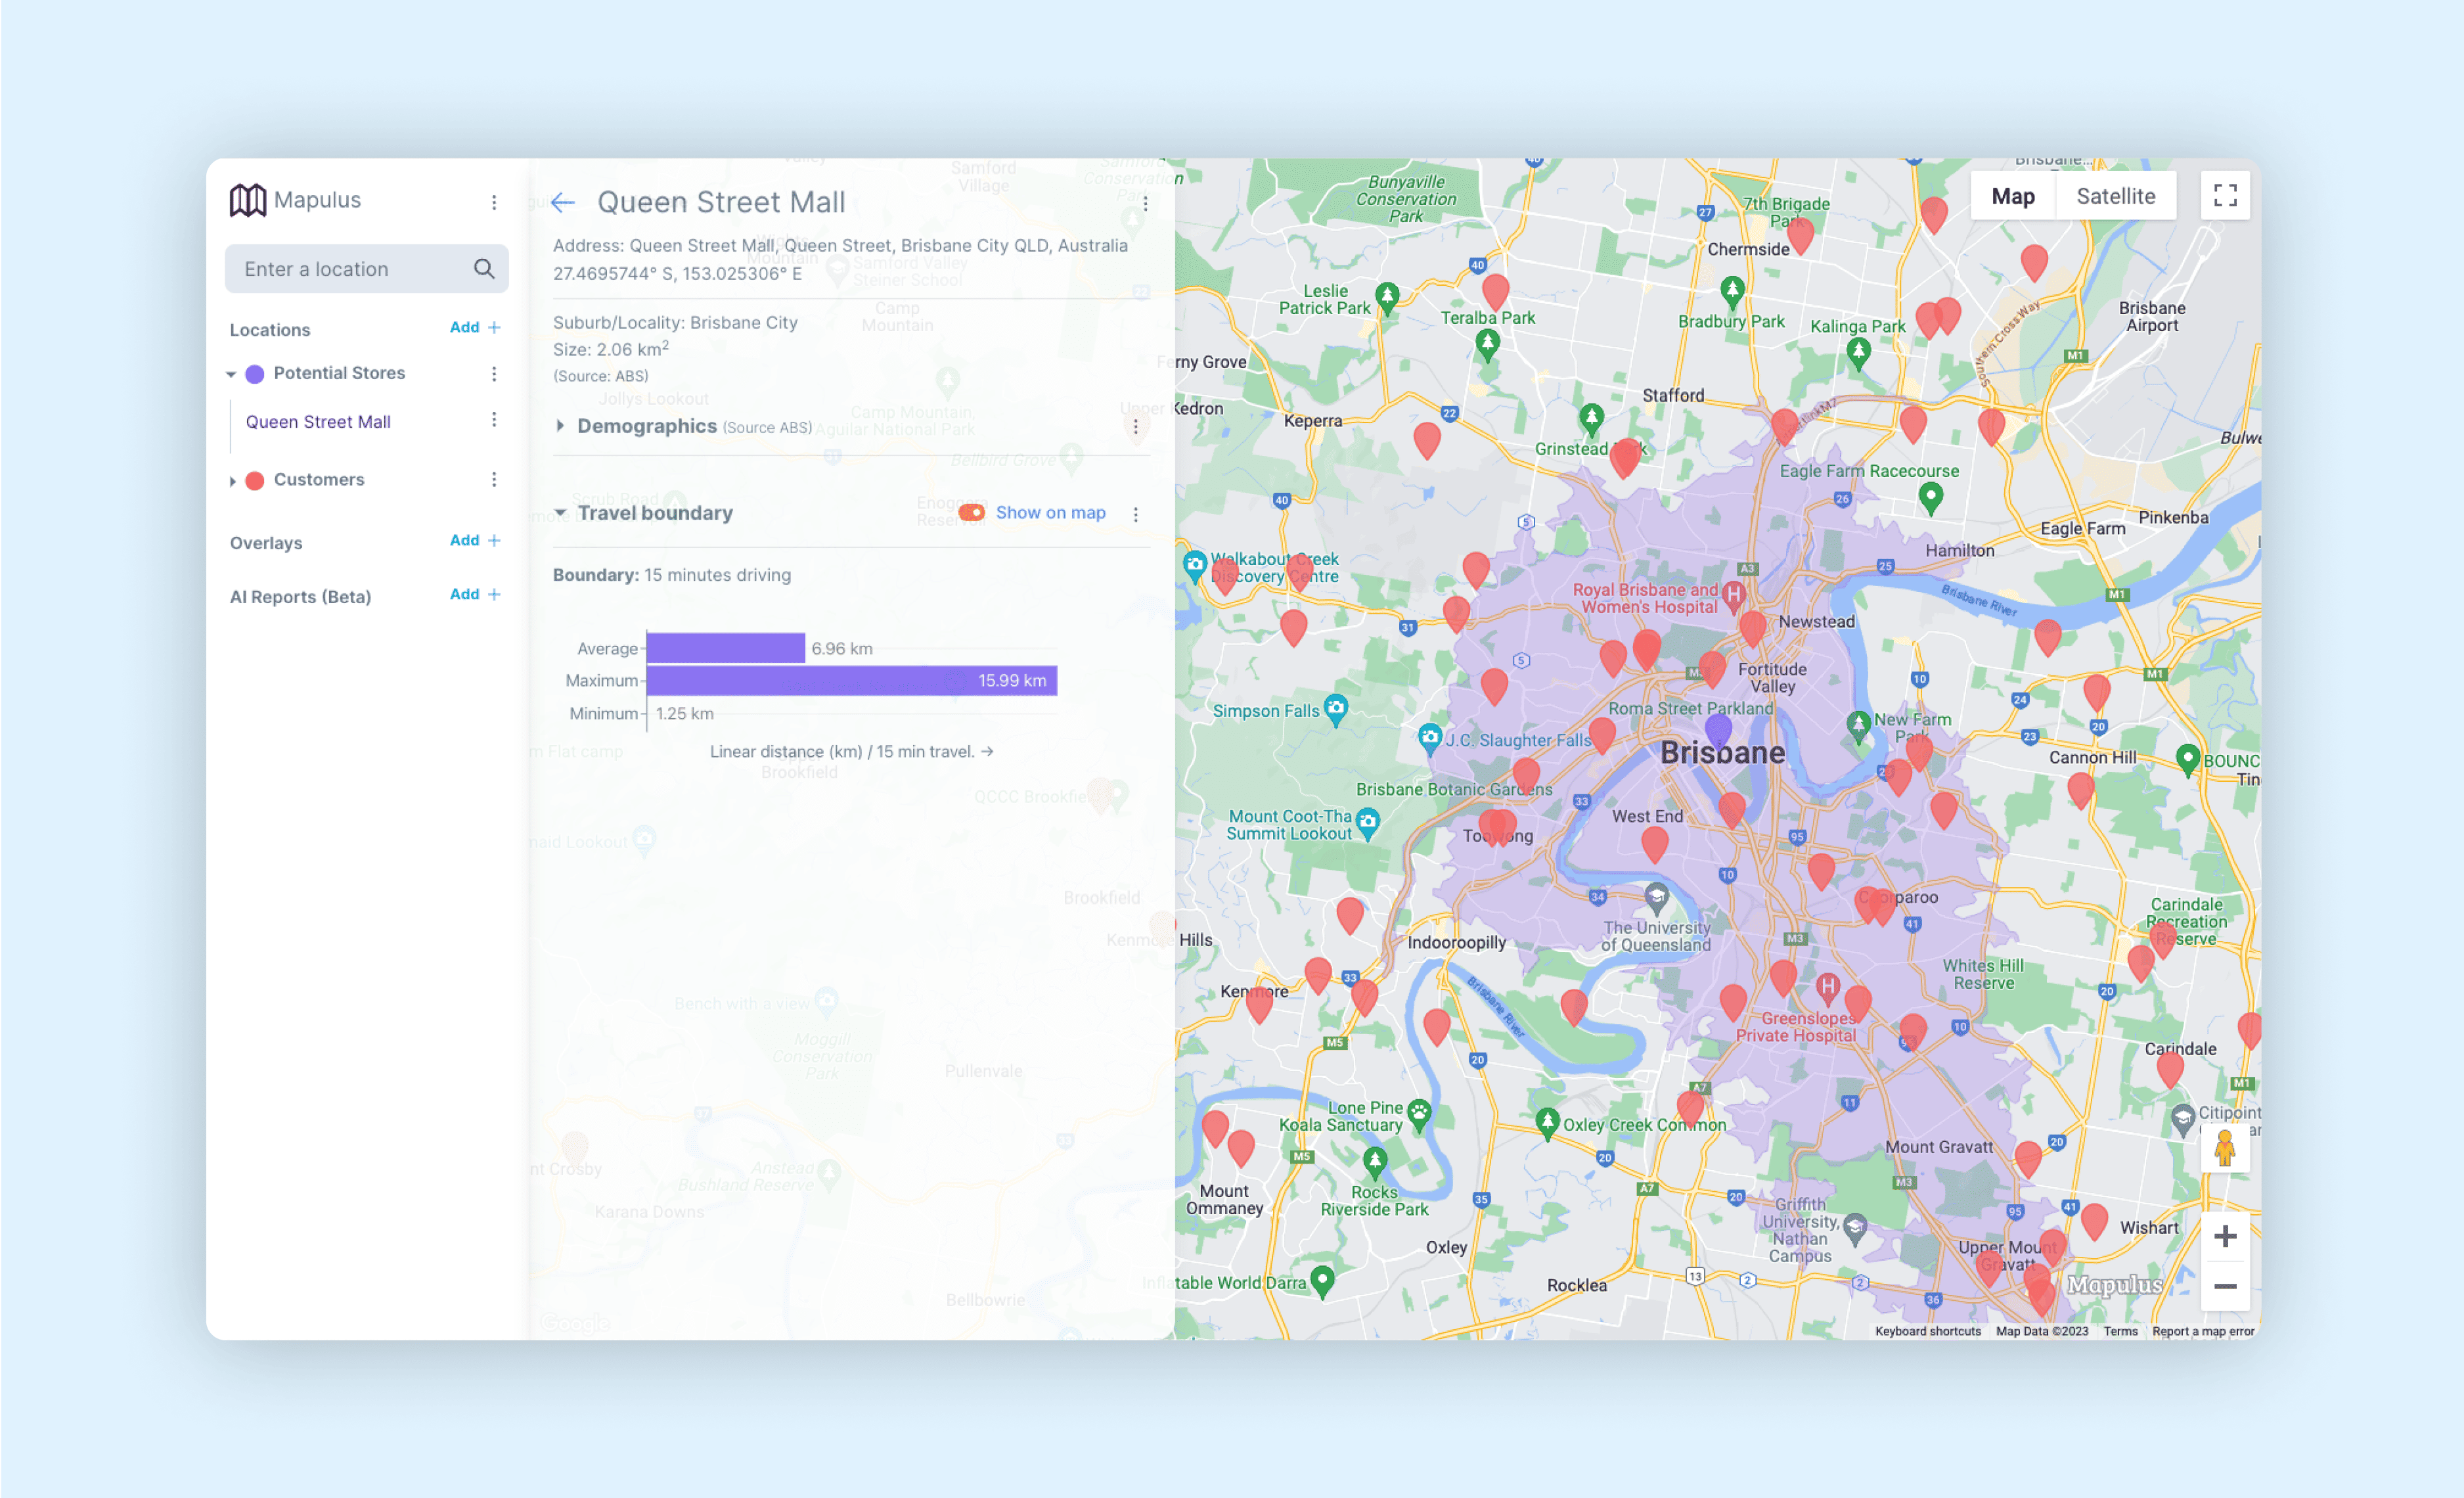
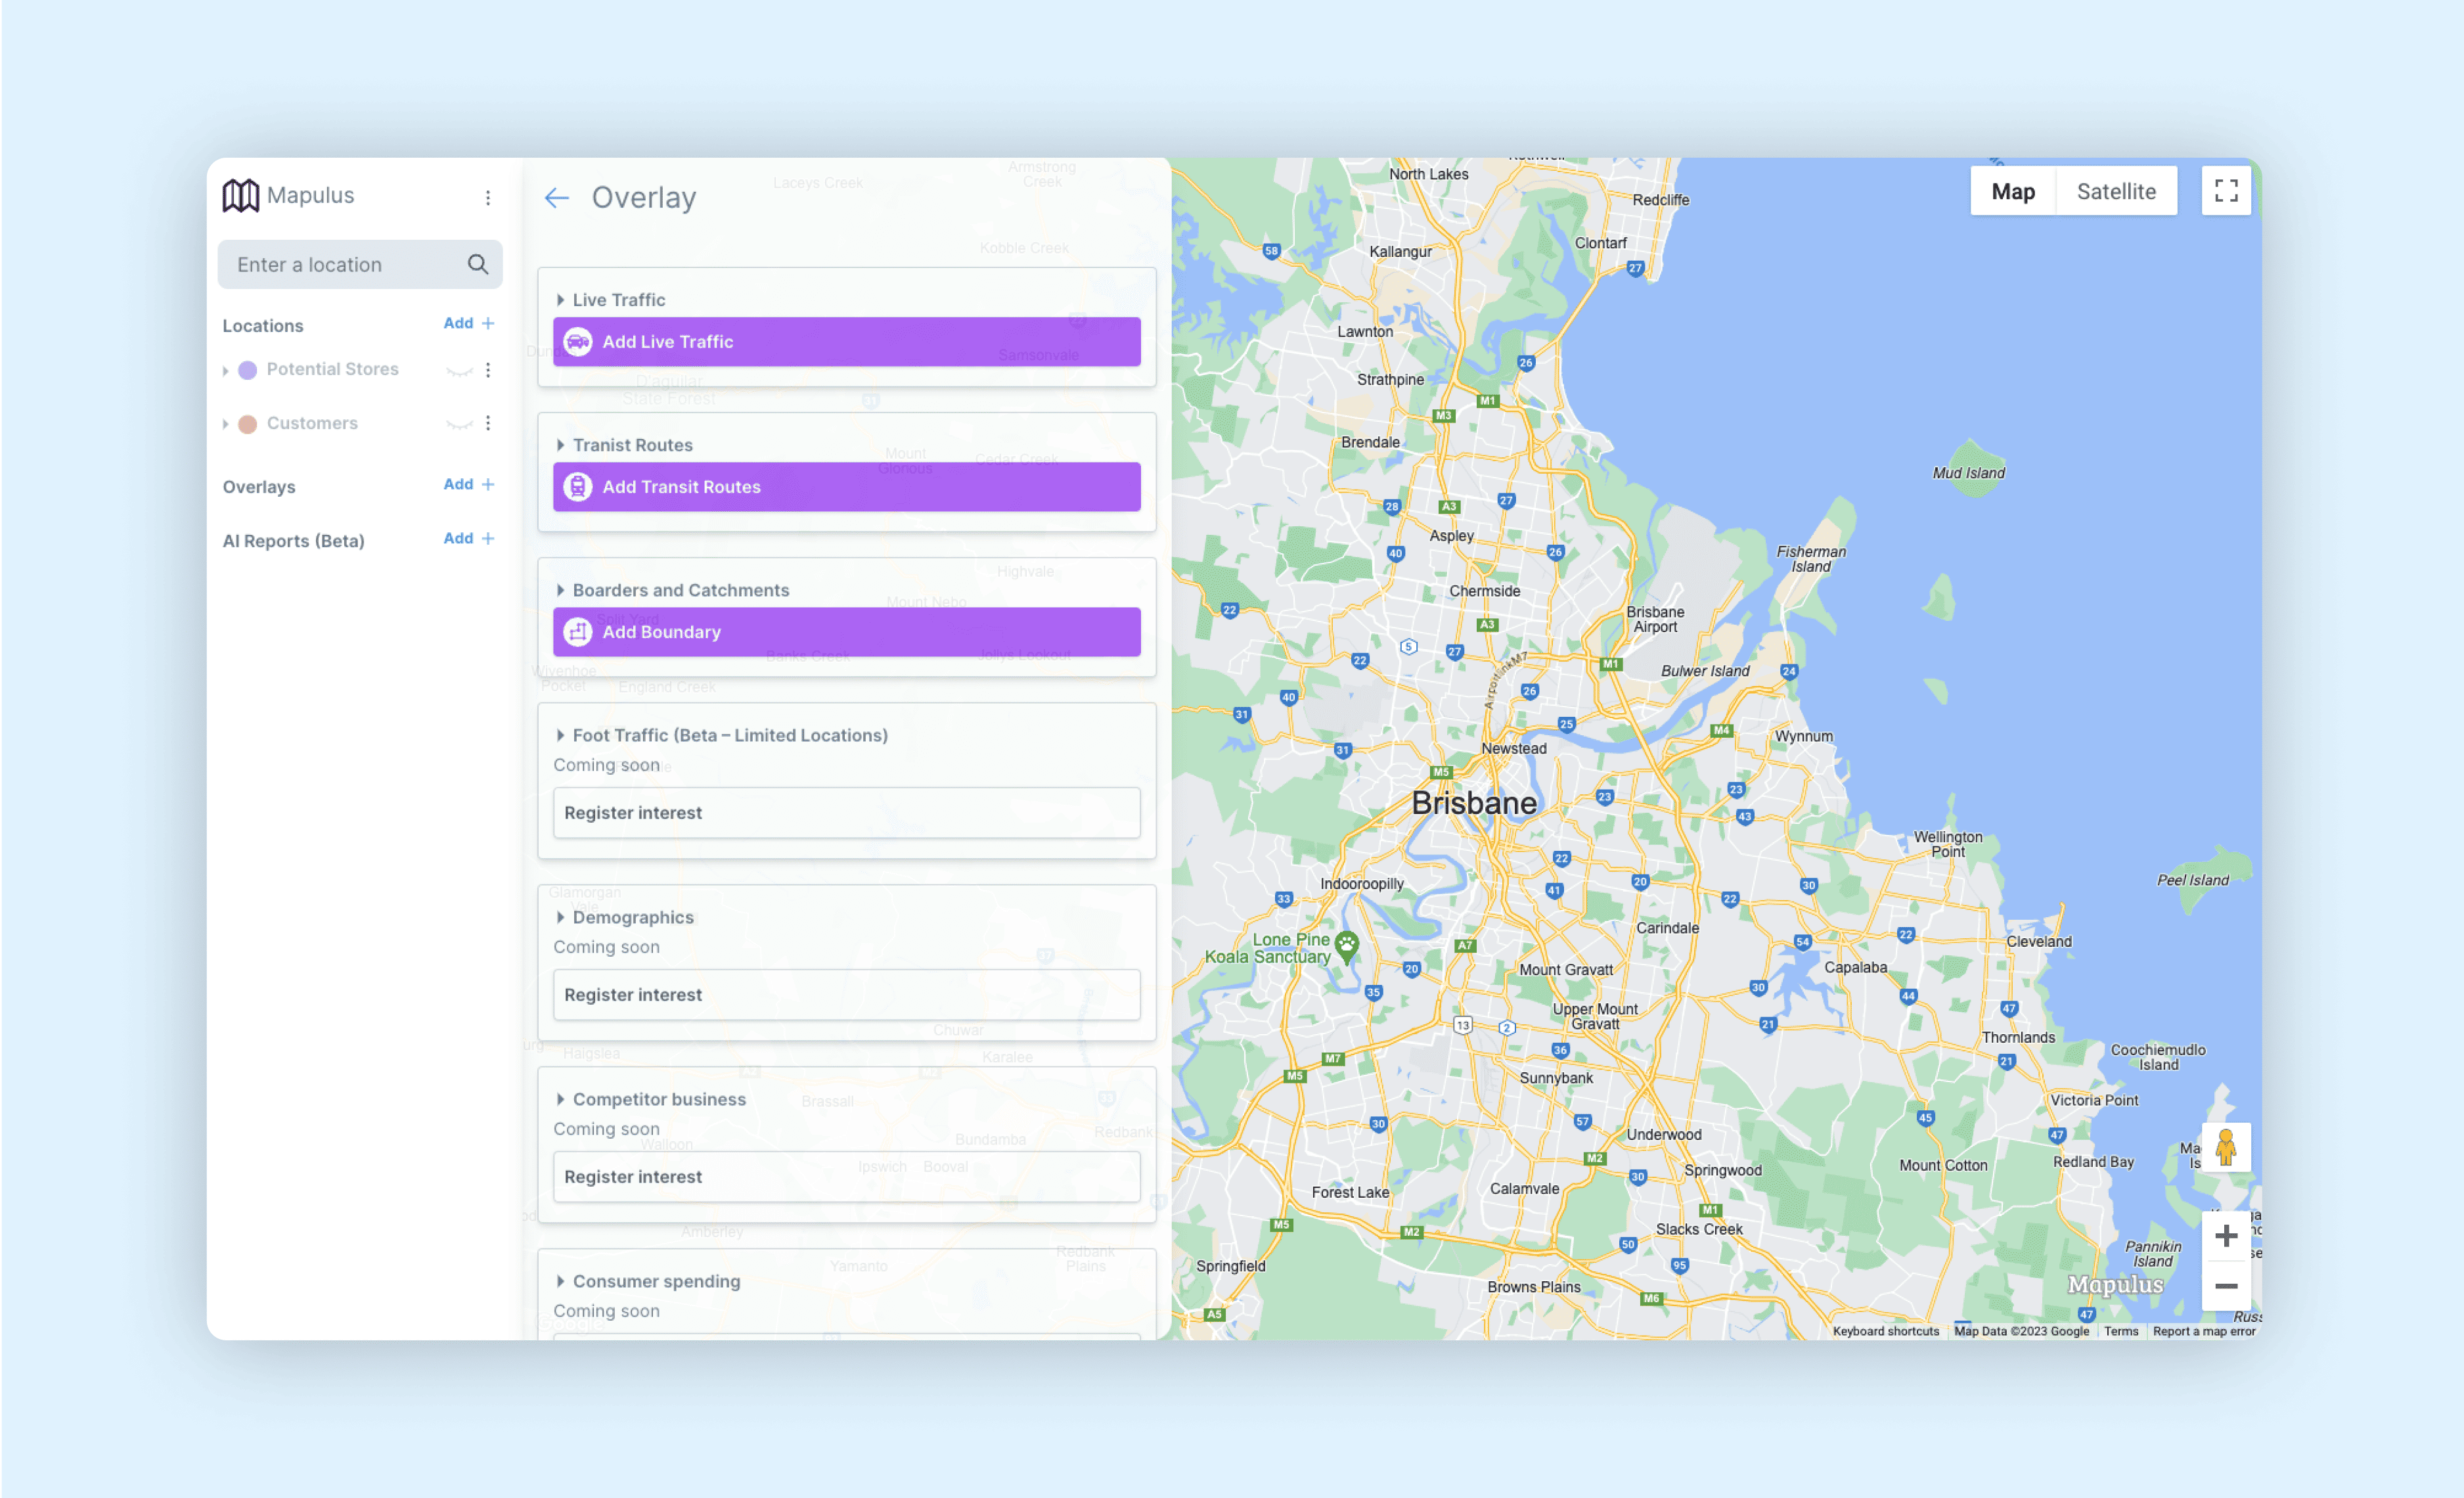
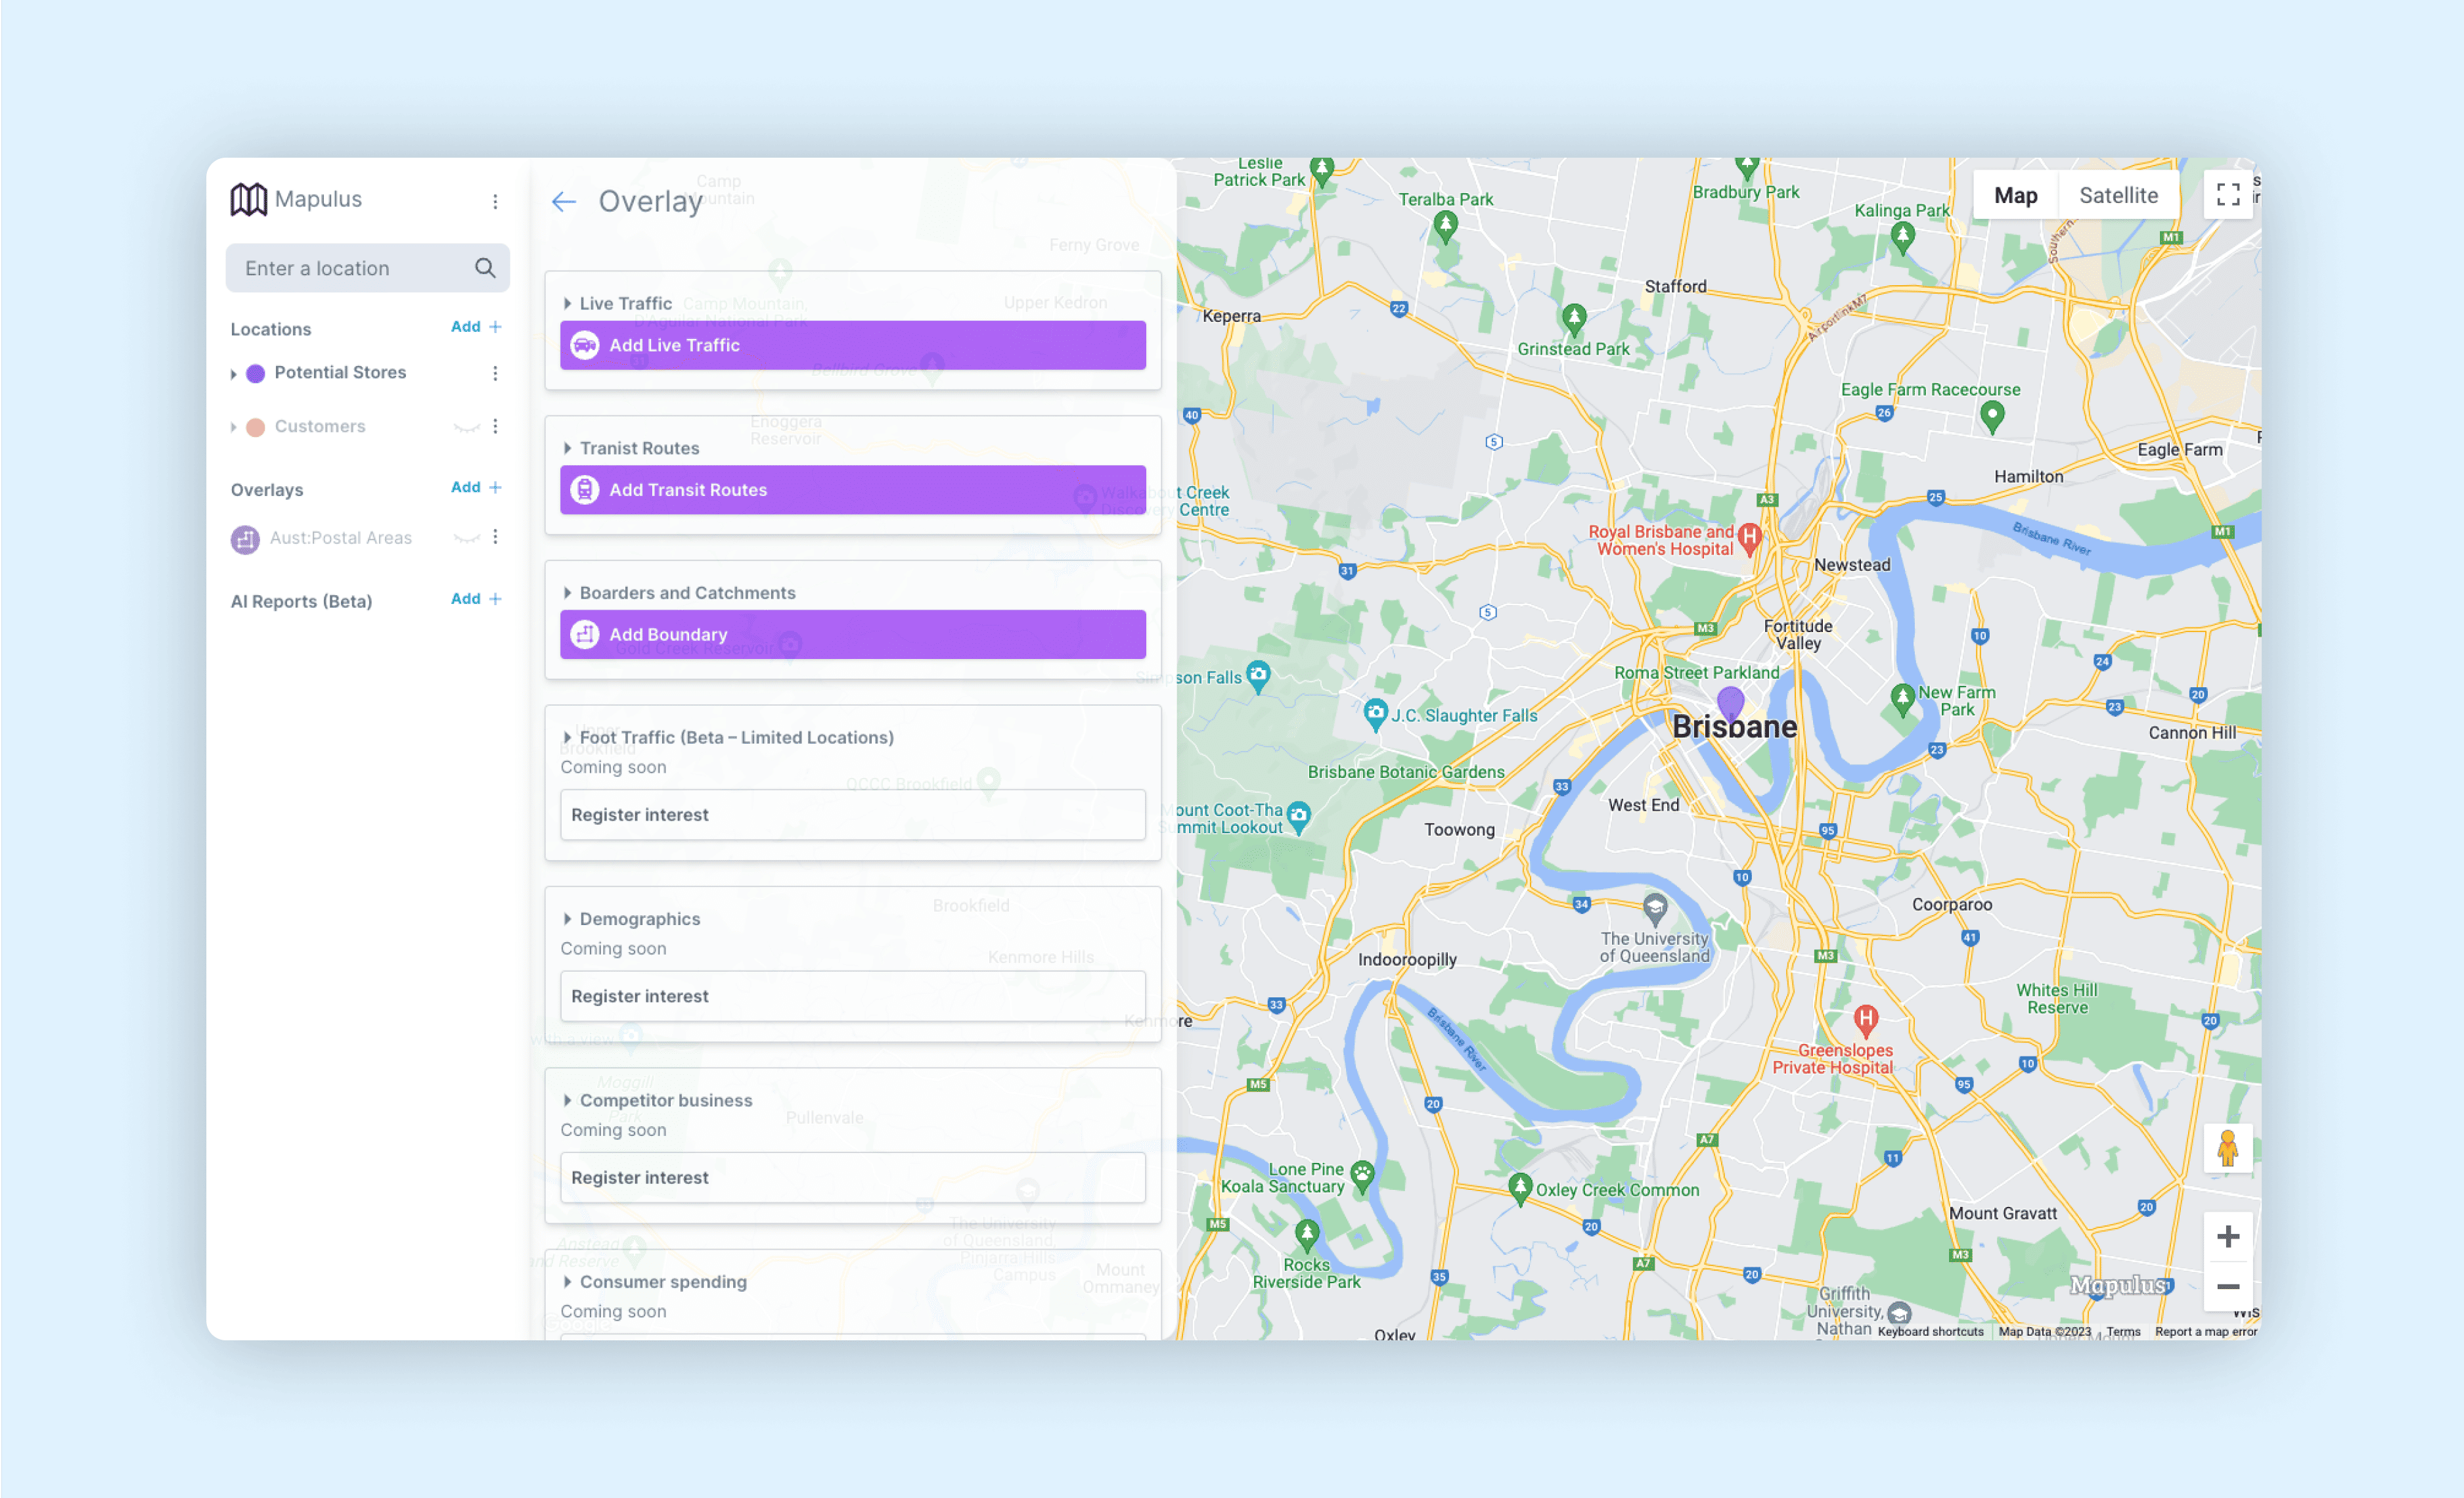
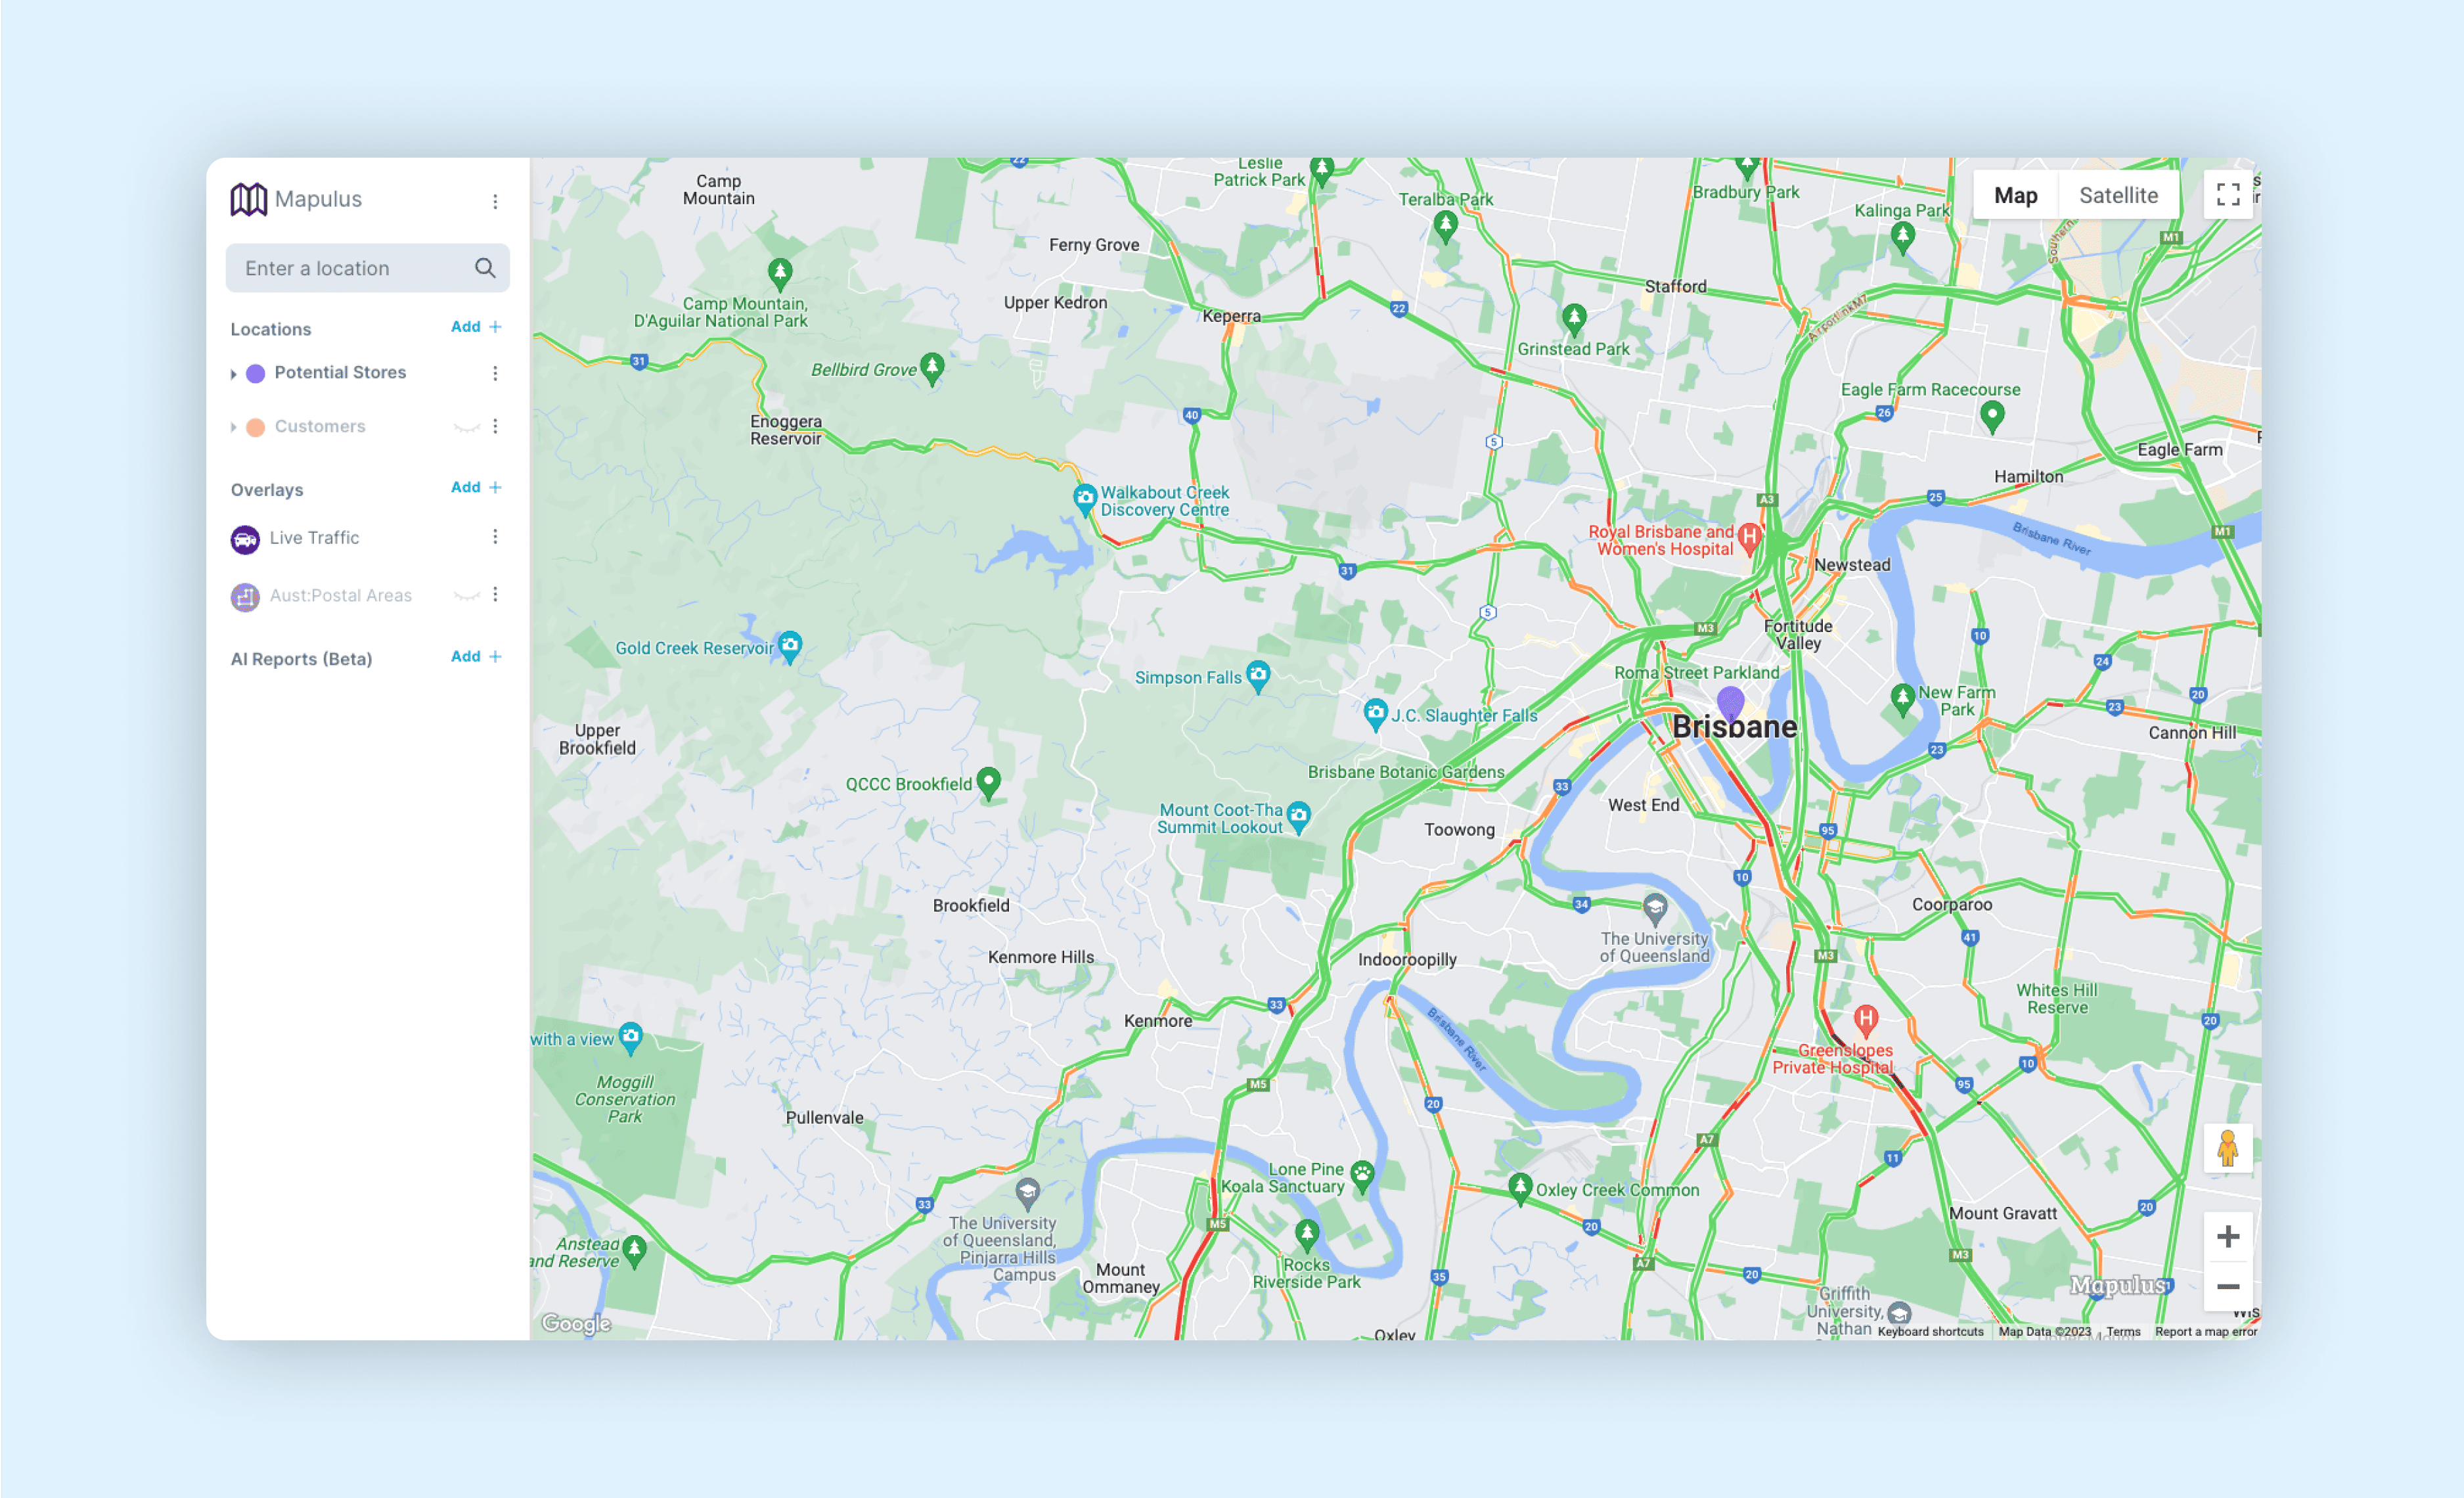
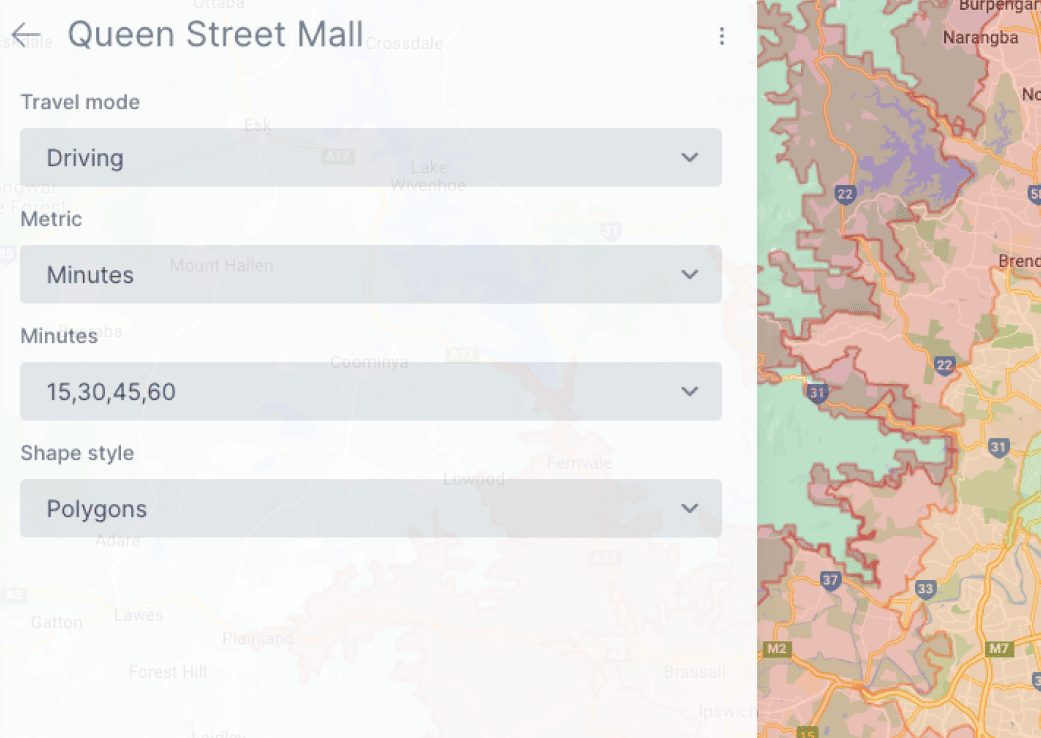
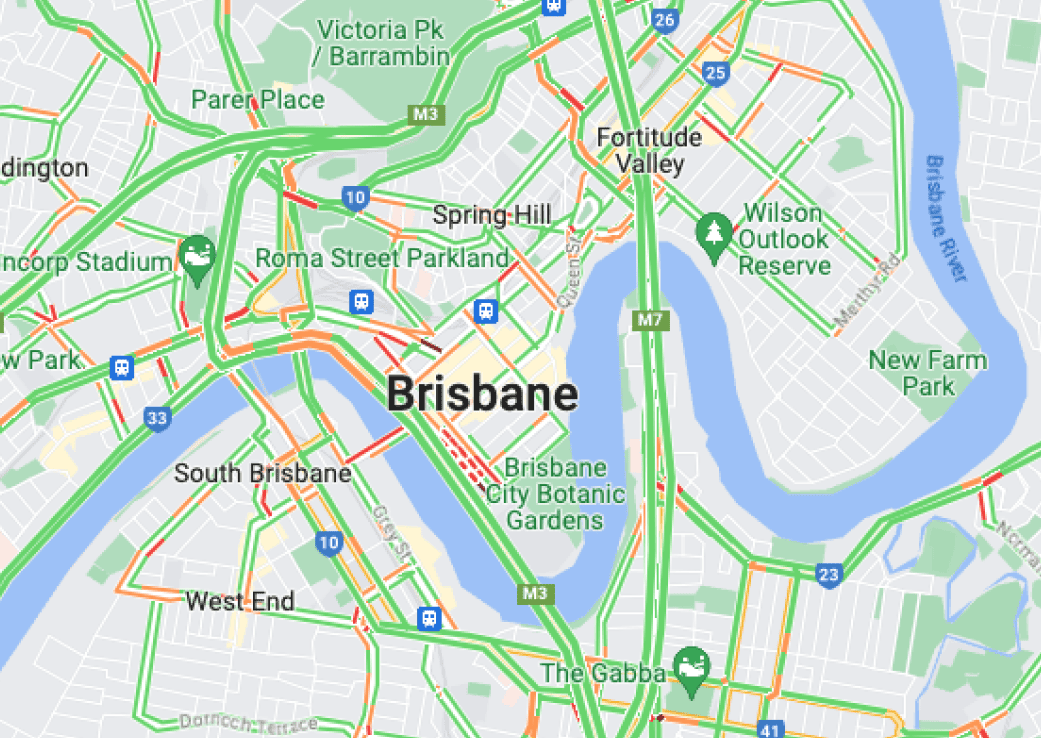
Overlay traffic flow, and travel time boundaries to fine-tune areas of operation or investment. Optimally place and market businesses with insights that ensure you're in the right place at the right time. Tailor the territories you service with precision, ensuring efficient service delivery and maximised returns.
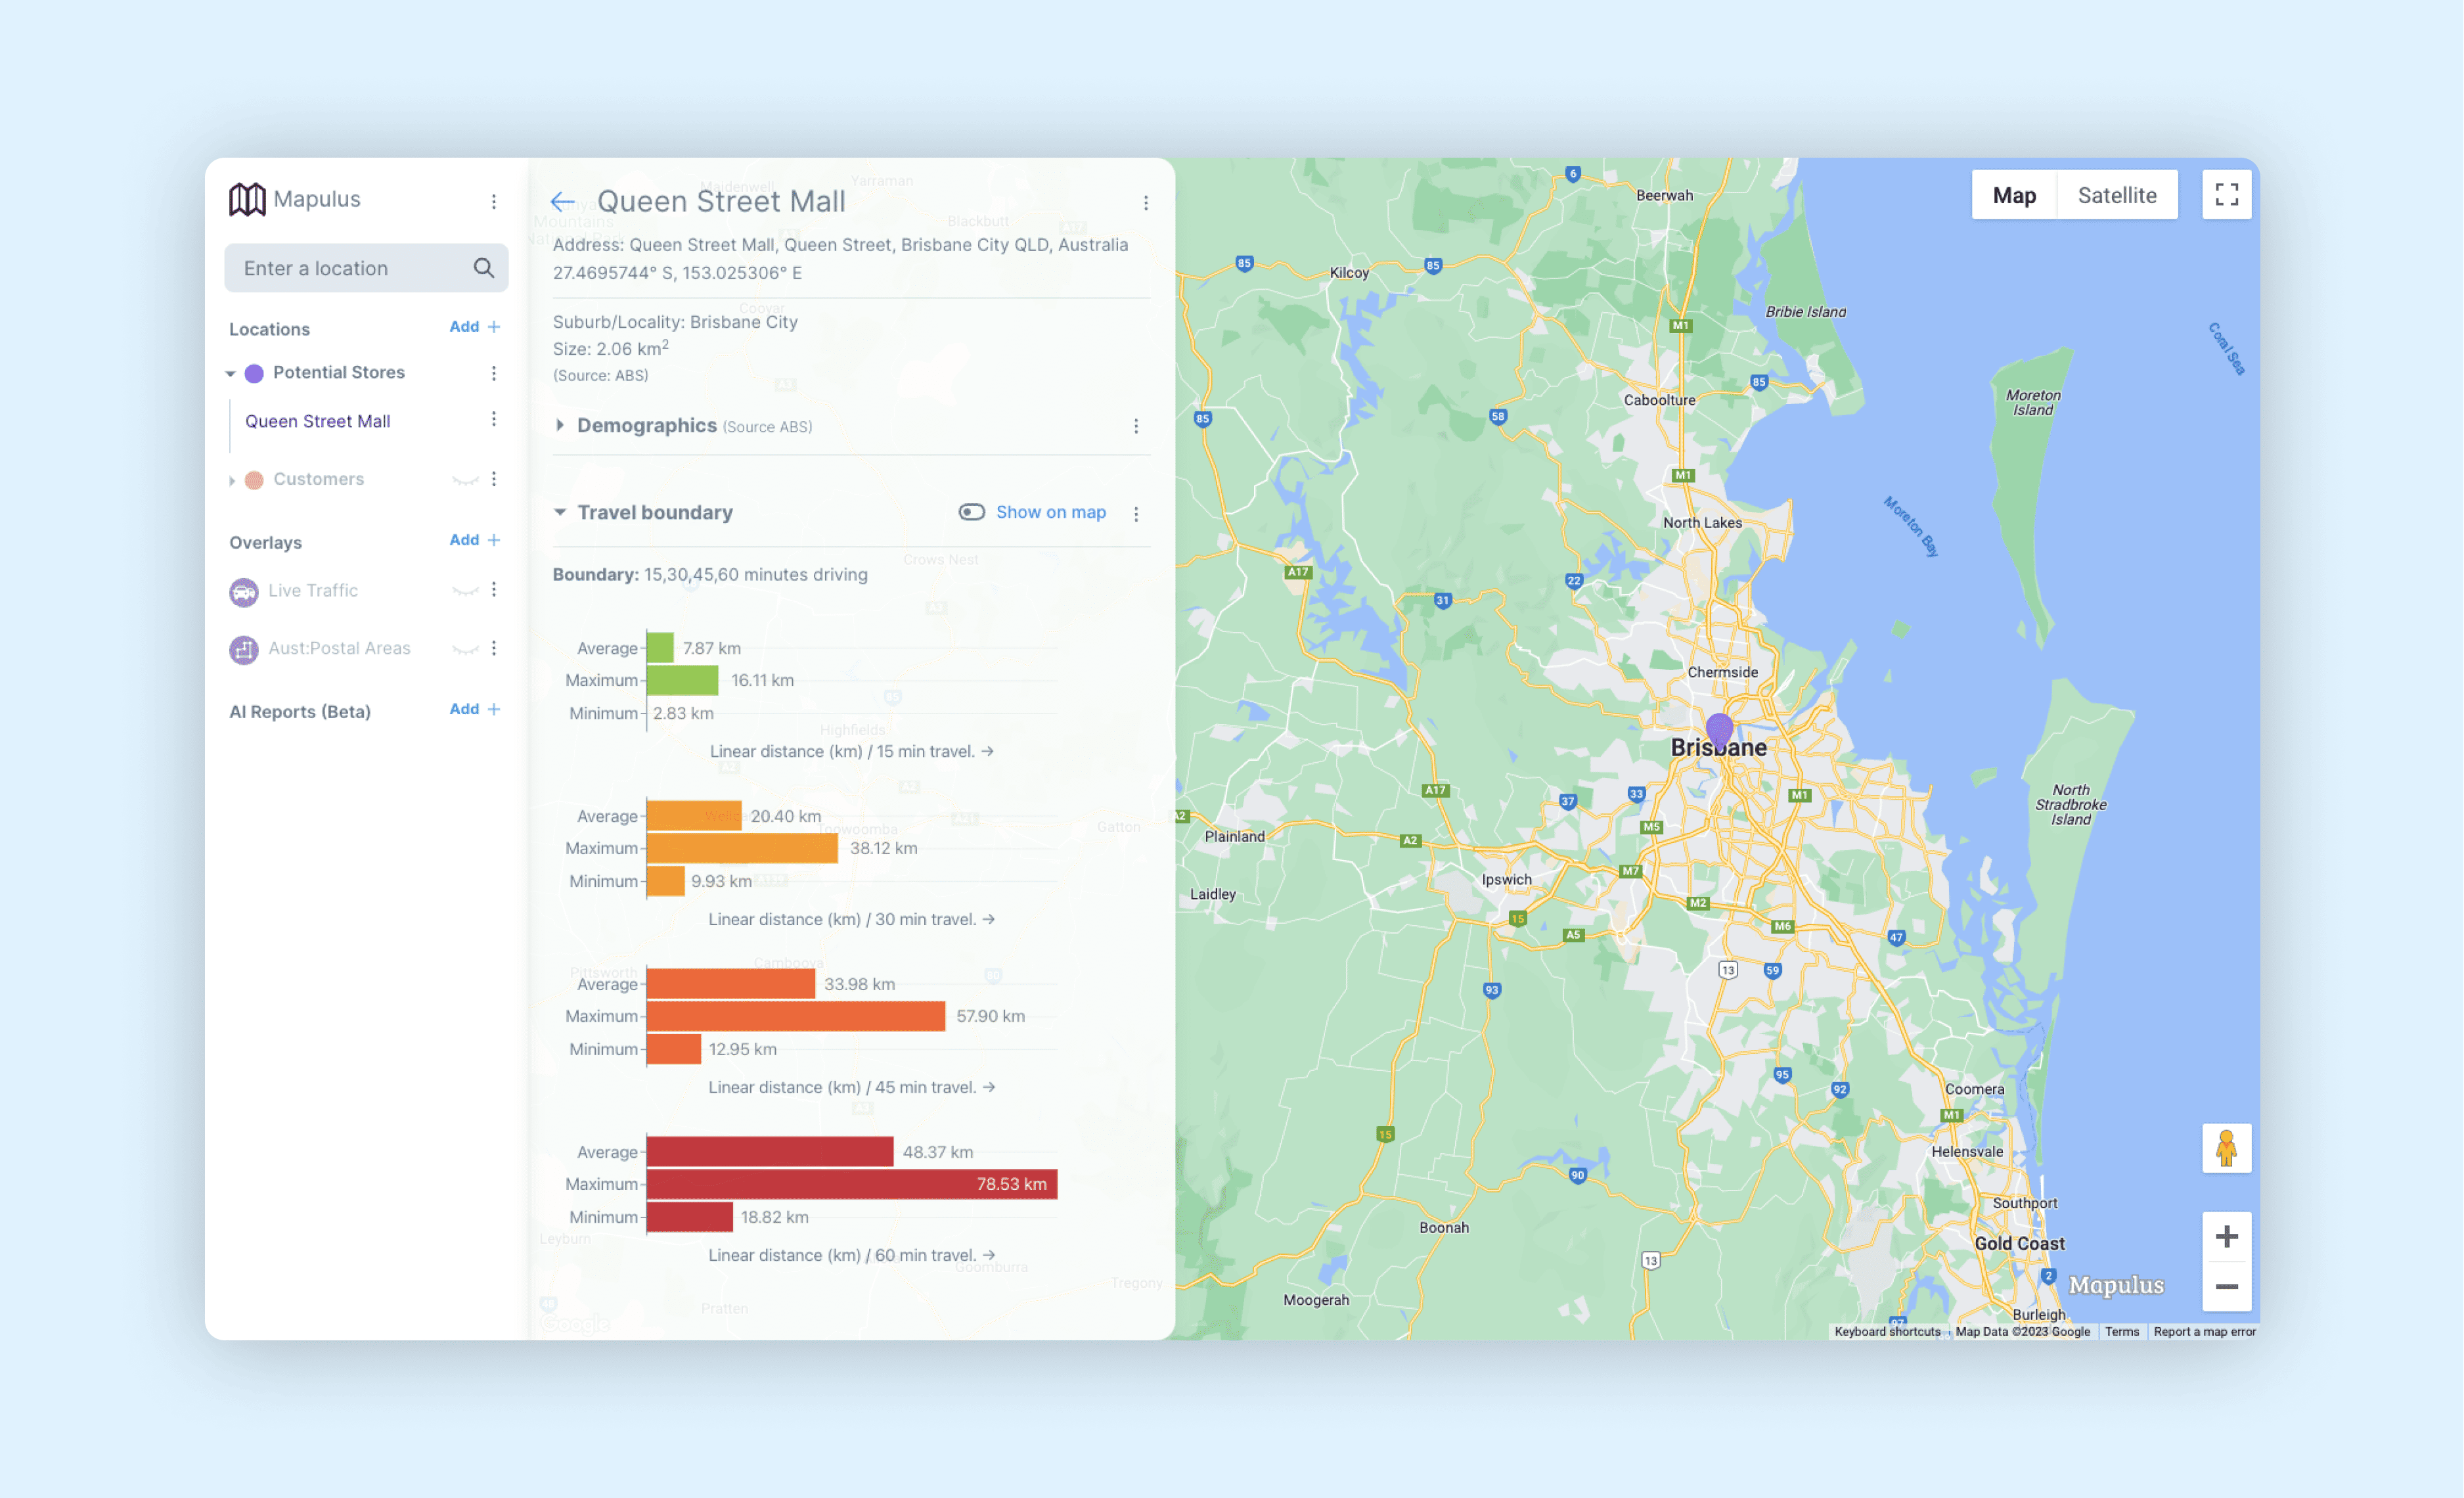
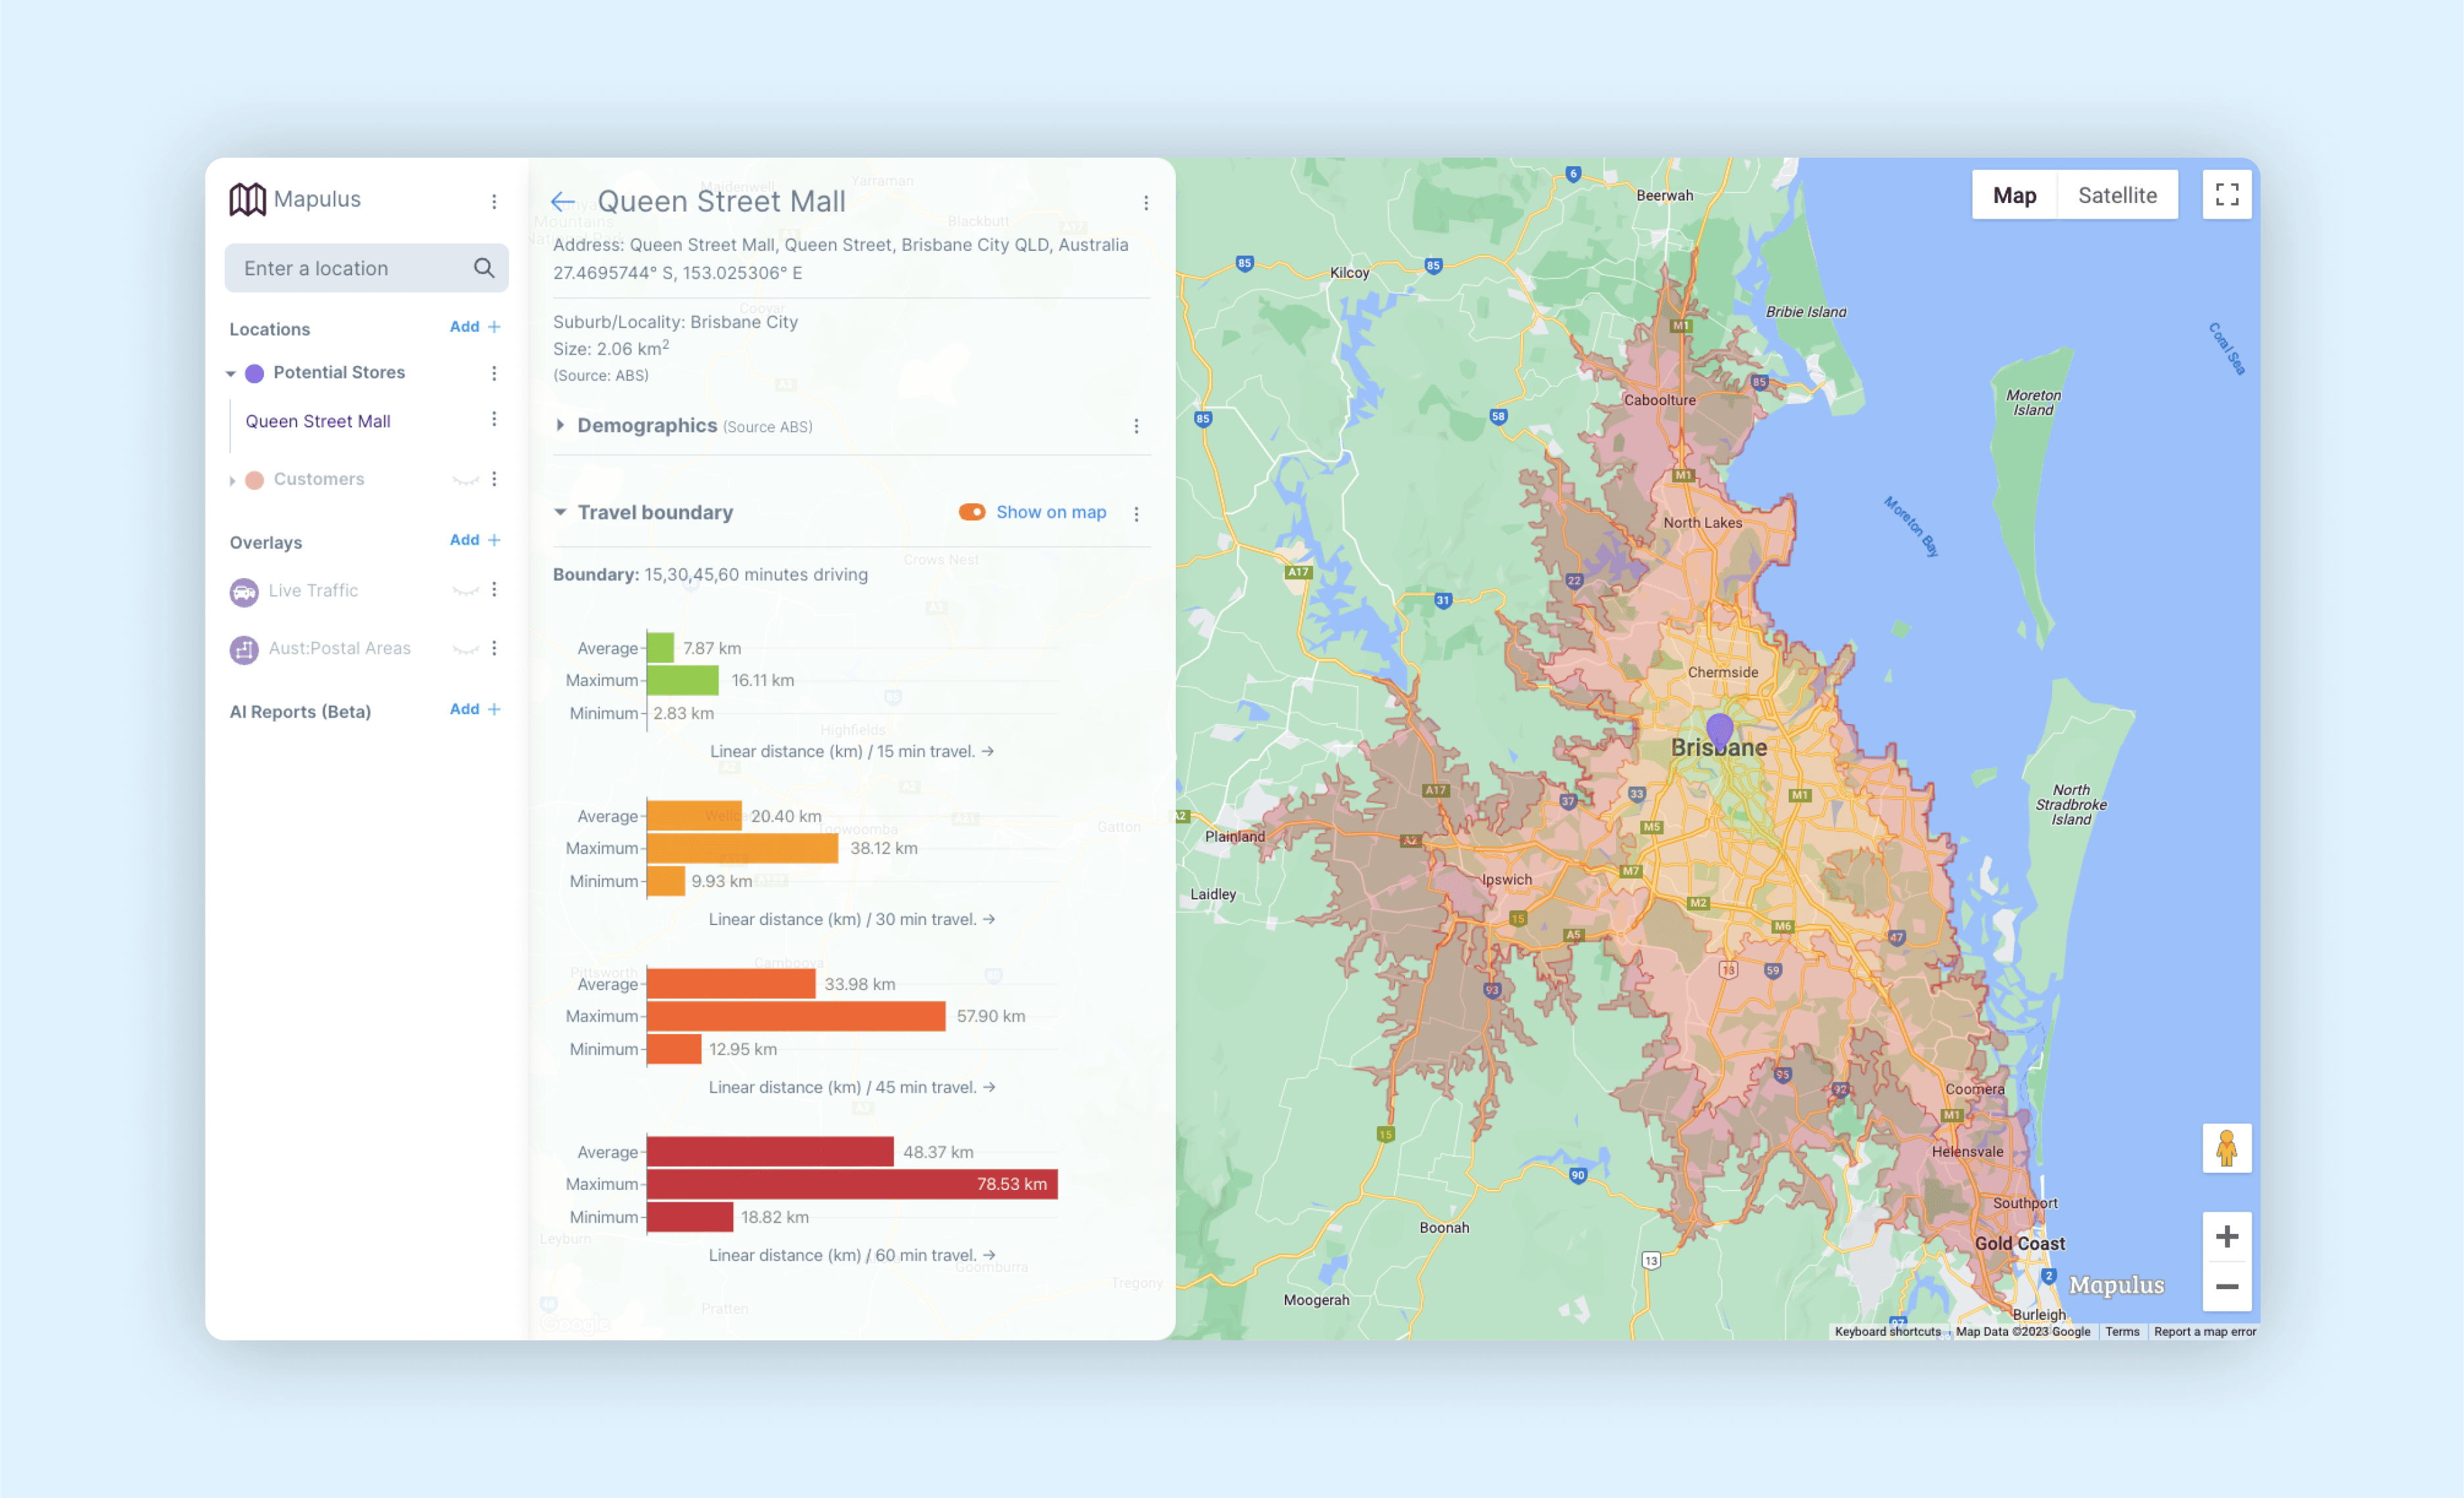
Define your operation zones with flexibility. Adjust and modify travel boundaries to align with business objectives, ensuring you focus on the regions that most matter to you.
Stay ahead by integrating real-time traffic data into your location analysis. Make timely decisions by understanding traffic patterns.
Understand the distance your customers are willing to travel, enabling you to optimise location offerings to meet their needs.
At Mapulus, we understand that you may have unique needs and requirements or need more in-house expertise to get the most from Mapulus. That's why we offer professional services, including custom analysis and reports, plus our team of developers. Our team of experts can work closely with you to understand your needs.