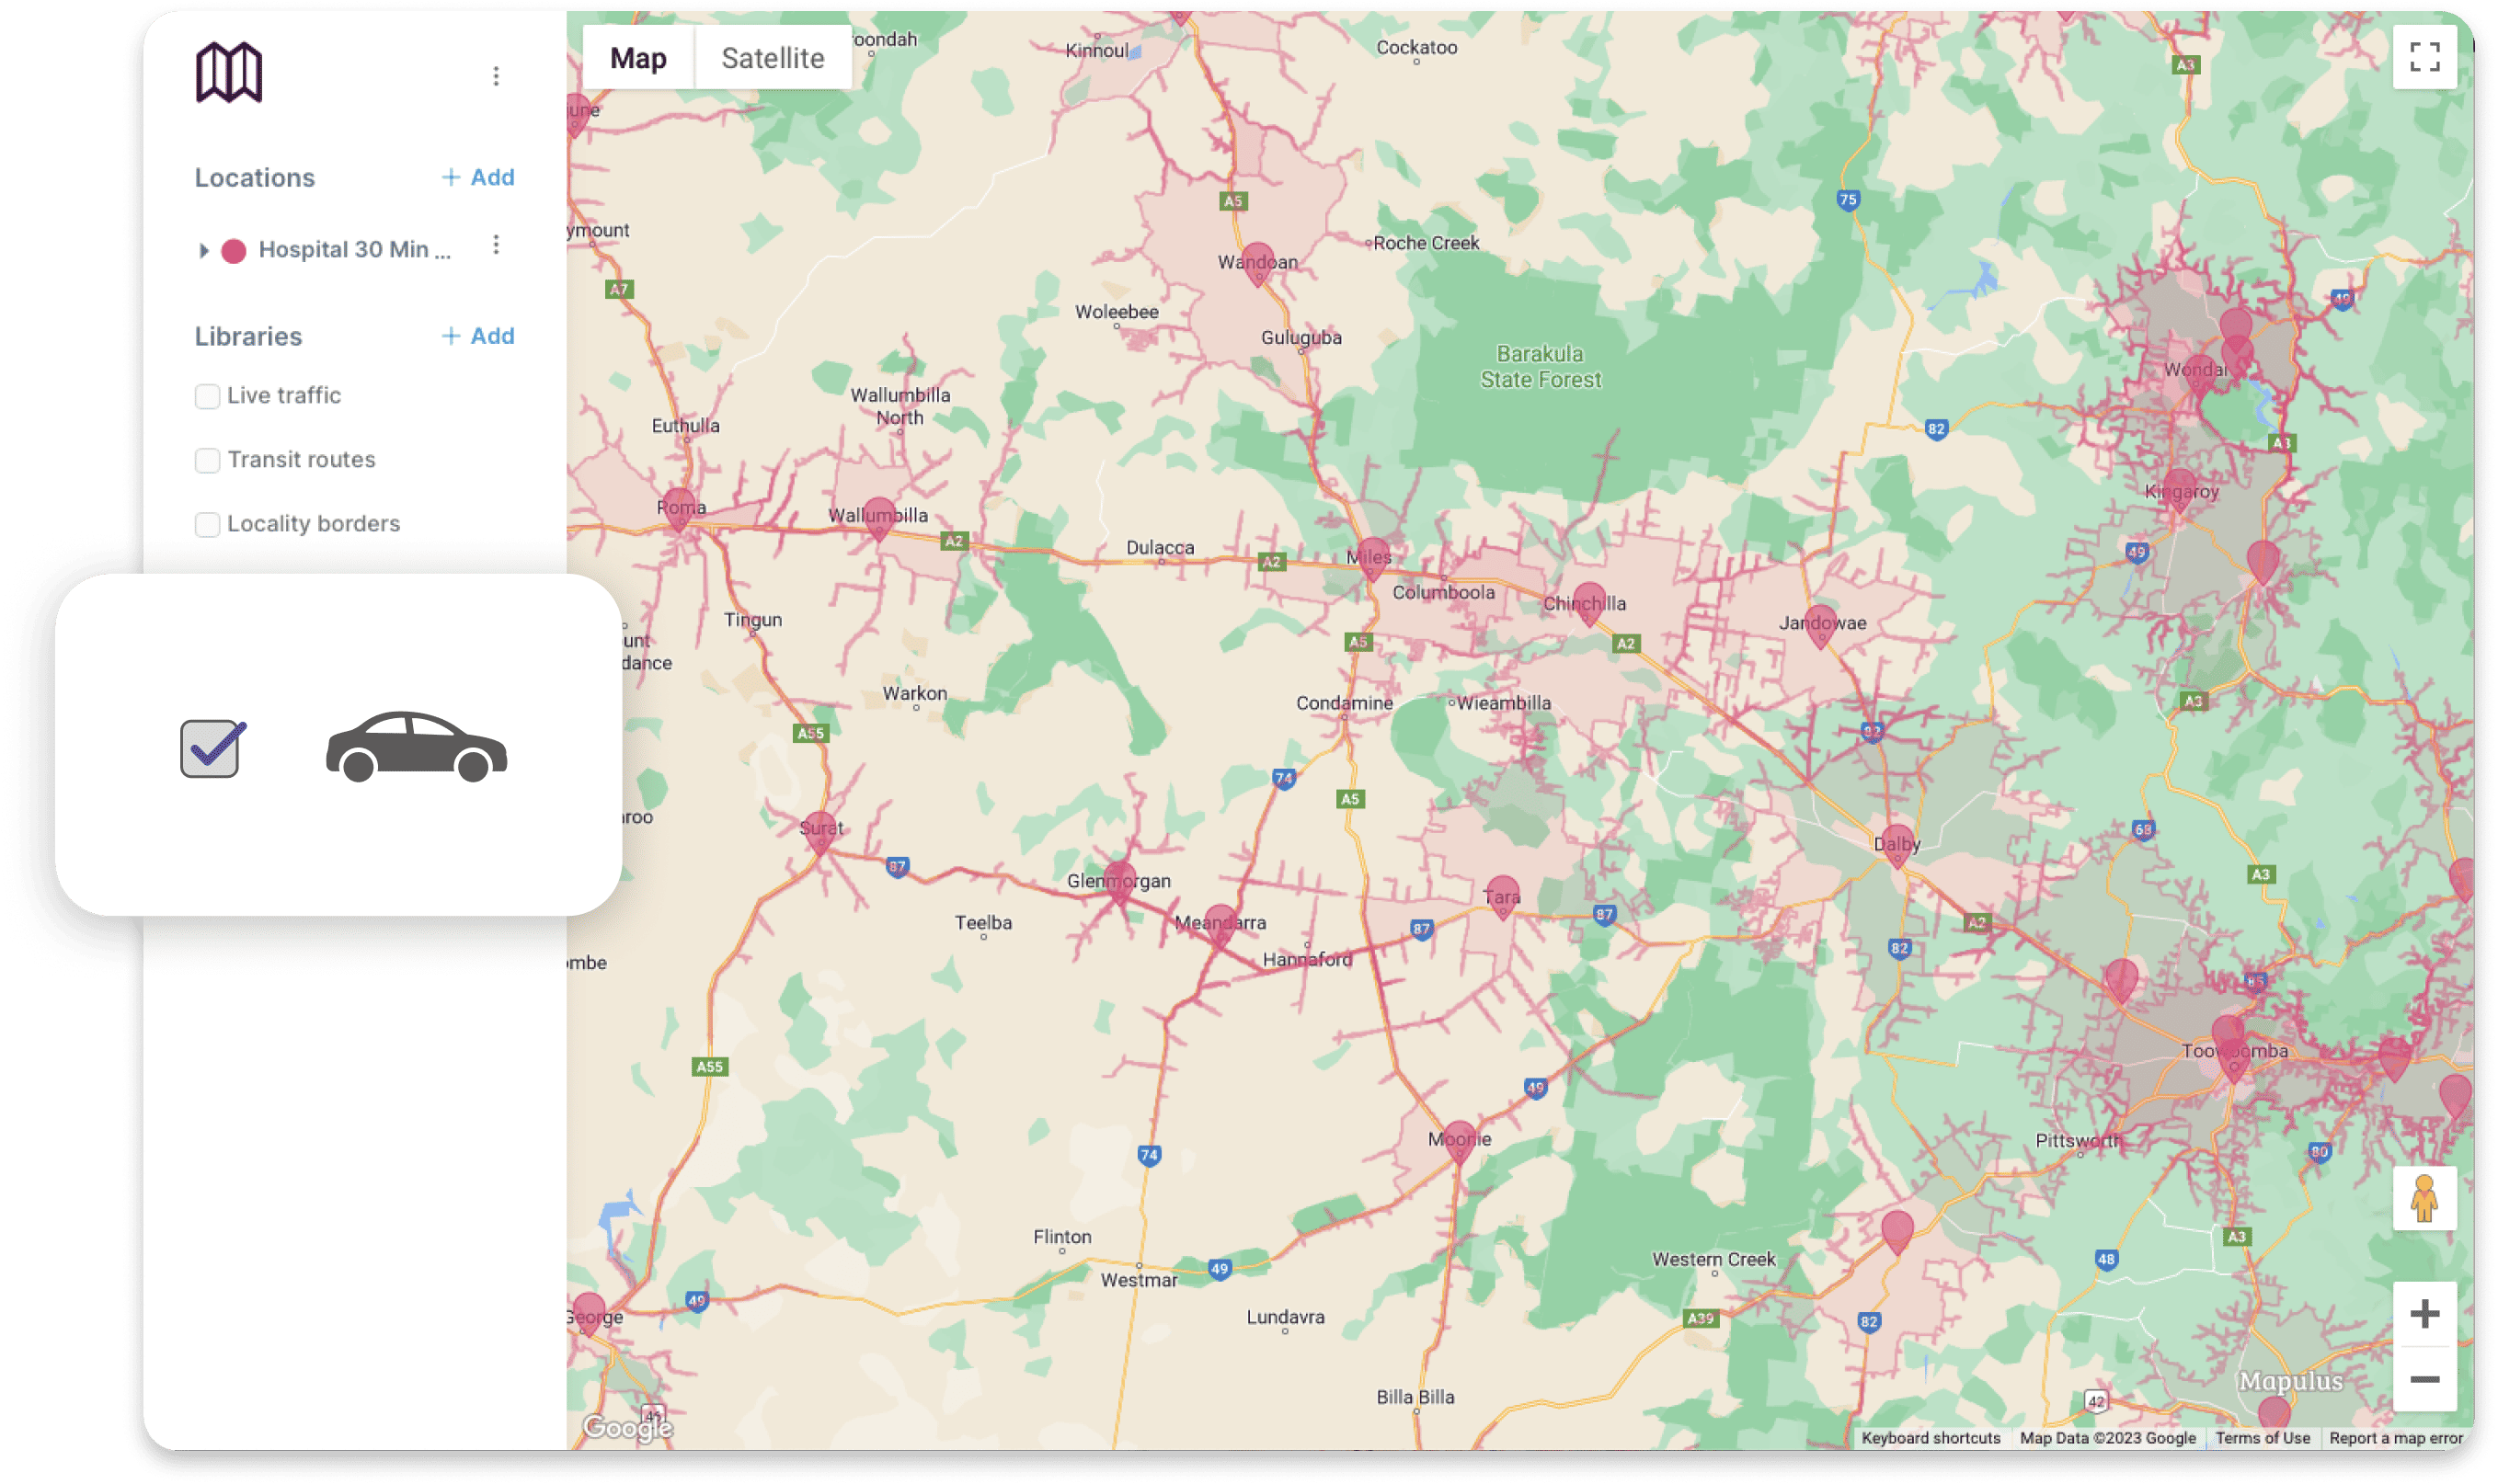
An intuitive and user-friendly platform that allows you to pin and plot locations on a map, and add travel boundaries to visualise reach and coverage.
Perfect for visualising retail locations, mapping service delivery and logistics, comparing real estate options, and planning localised marketing campaigns.
A world of insight is waiting.
Sign up for a free trialAdding your own locations is a breeze - whether you have just an address or latitude and longitude coordinates. Our user-friendly interface allows you to quickly and easily ad a single location or import bulk locations with a CSV, making it simple to manage large datasets.
You can add your locations to different layers, making it easy to organise and manage multiple sets of data. This means you can label locations and layers, adding a customised touch to your maps and ensuring that they are easy to navigate and understand.

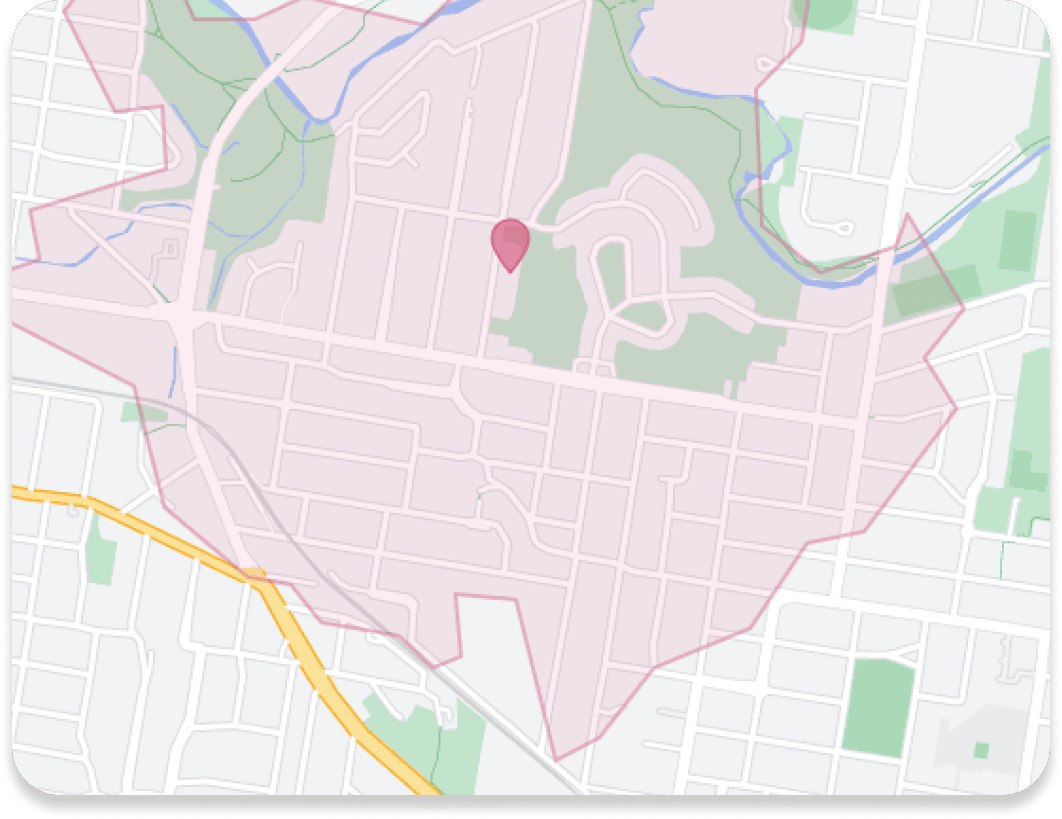
Defining travel boundaries has never been easier. Our innovative platform allows you to set travel boundaries, called isochrones, that visualise the travel reach around a location. By setting a 30-minute drive time travel boundary around a location, for example, you can easily see where your customers live and how far they might be willing to travel to visit a retail store.
With our user-friendly interface, you can also see where a service delivery person can reach within a certain drive time, making it easy to plan logistics and optimise delivery routes. Our isochrone feature can be customised to fit your unique needs, allowing you to define travel boundaries that suit your business and your customers.
Simply plotting locations on a map is just the beginning. That's why our innovative platform offers the ability to cluster locations and create heat maps, providing a powerful tool for visualising patterns and insights in your data.
Our clustering feature allows you to group locations close to each other, making it easier to see where your business has a concentration of customers or operations.
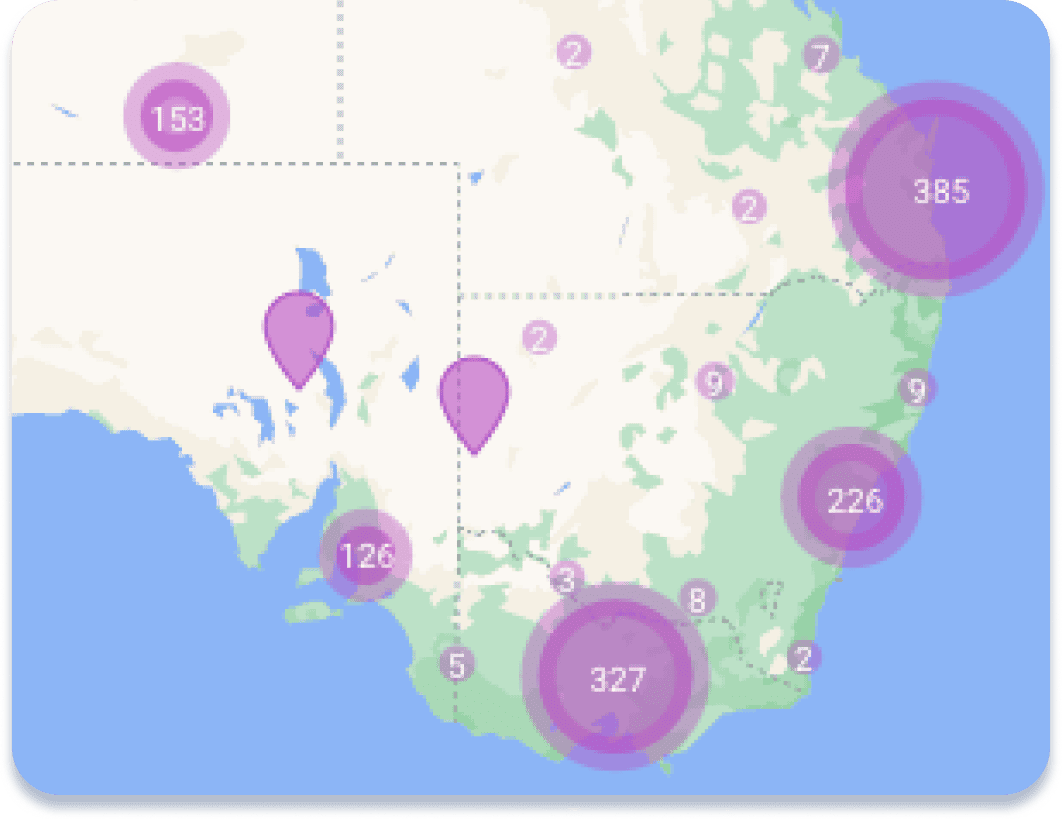
Mapulus offers a powerful heat map feature that allows you to identify hotspots and visualise data density across a specific area. This feature is perfect for businesses looking to gain valuable insights into their operations, helping them to make more informed decisions about where to focus their resources.
By setting your locations as heat maps, you can easily identify areas with high customer traffic or a concentration of competitors. This information can be used to adjust your marketing strategies, optimise your delivery routes, or even open new store locations. With heat maps, you can easily visualise the data you need to make the most informed decisions for your business.