Mapulus is more than just a platform for plotting locations and defining travel boundaries. Enrich your maps with demographics, overlays of live traffic, public transport corridors, suburb and zip code boundaries, points of interest and more. By exploring these insights, you can gain a deeper understanding of how your location data is grounded in the lived experiences of people and communities.
A world of insight is waiting.
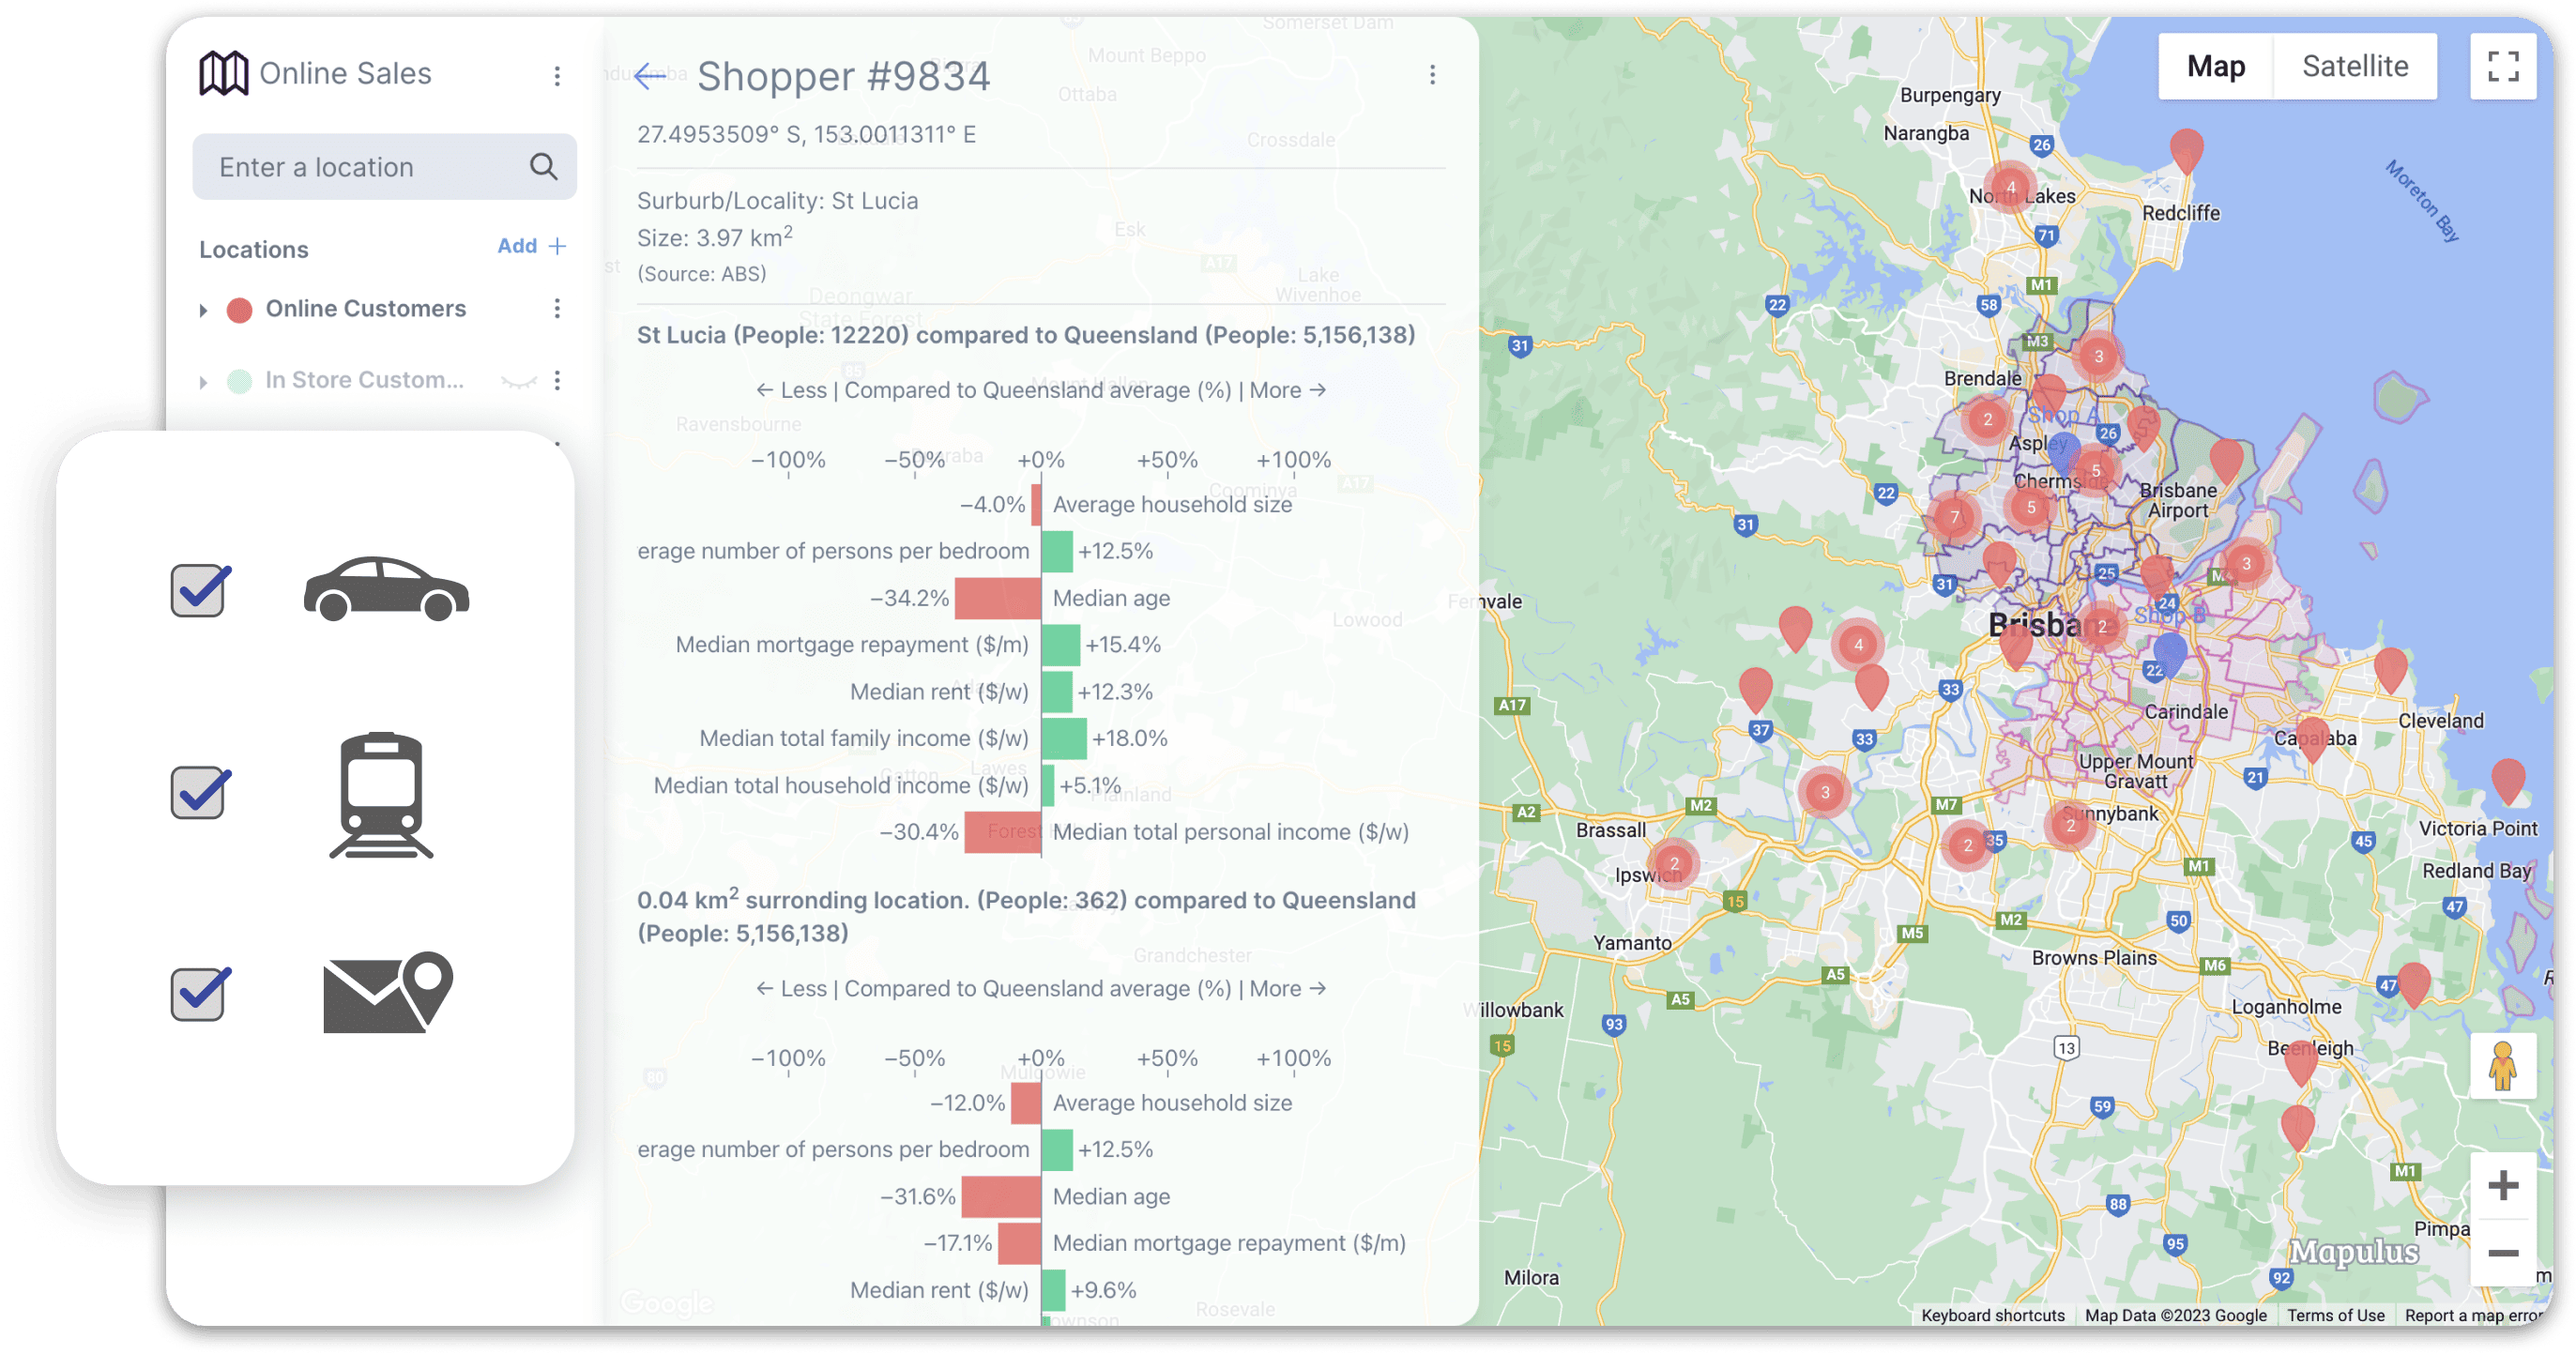
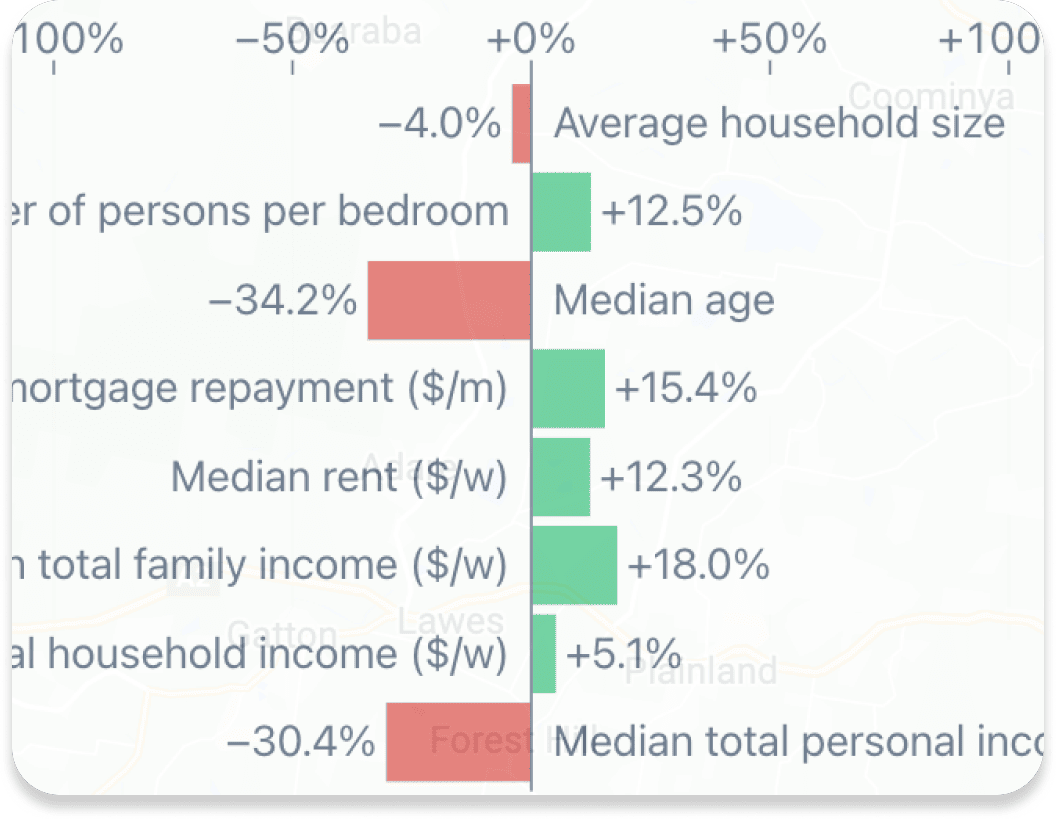
Sign up for a free trialCompare the demographics of a location to gain a comprehensive understanding of the people who live, work, and interact in that area. These rich demographic overlays help you to design strategies that resonate with the real-life characteristics and needs of local communities.
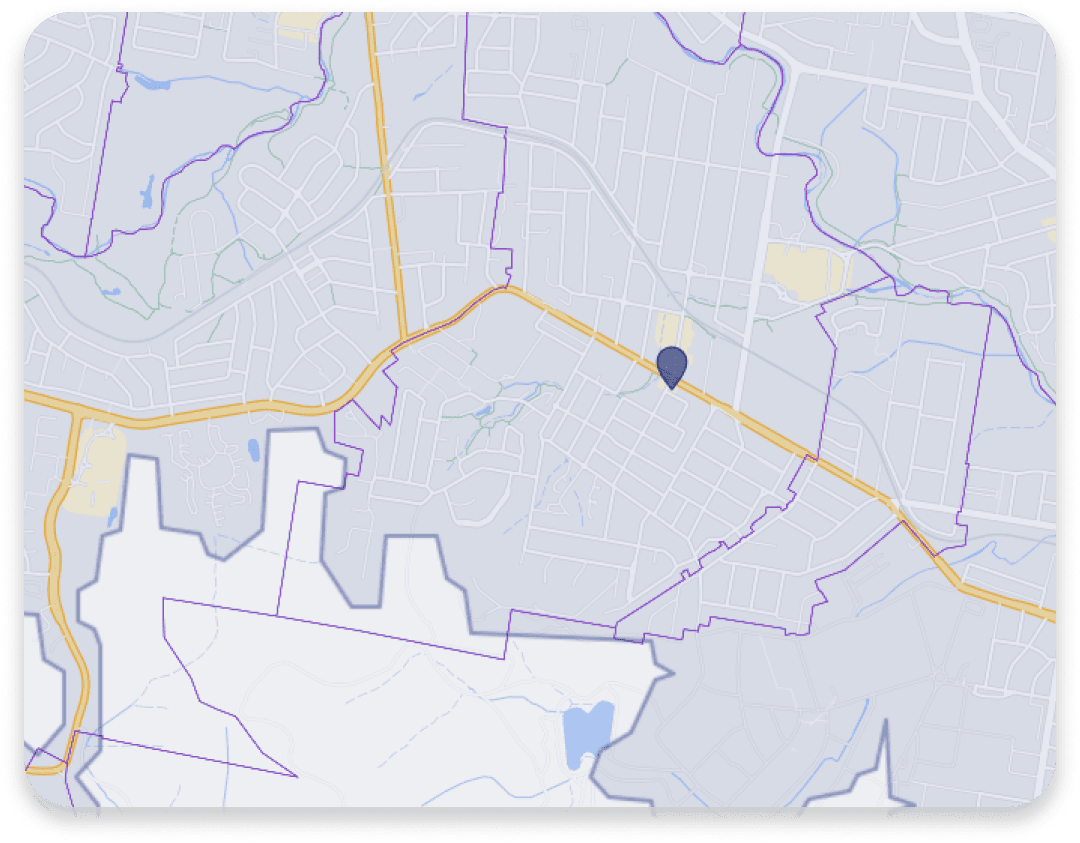
Highlight local boundaries, such as postal codes, city limits, or county borders, on your map (limited to certain locations). Gain valuable insights into the reach of your location or network. By overlaying your customer data onto your map, you can easily see where your customers are located and identify areas with growth potential.
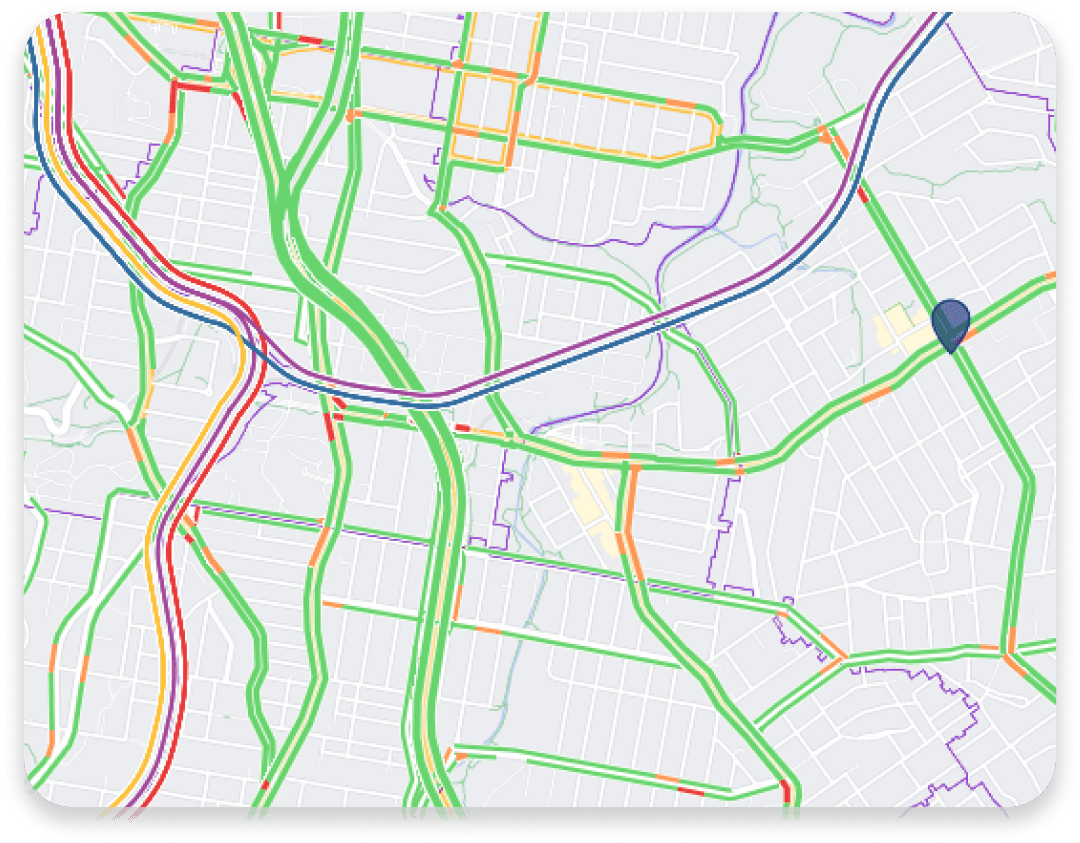
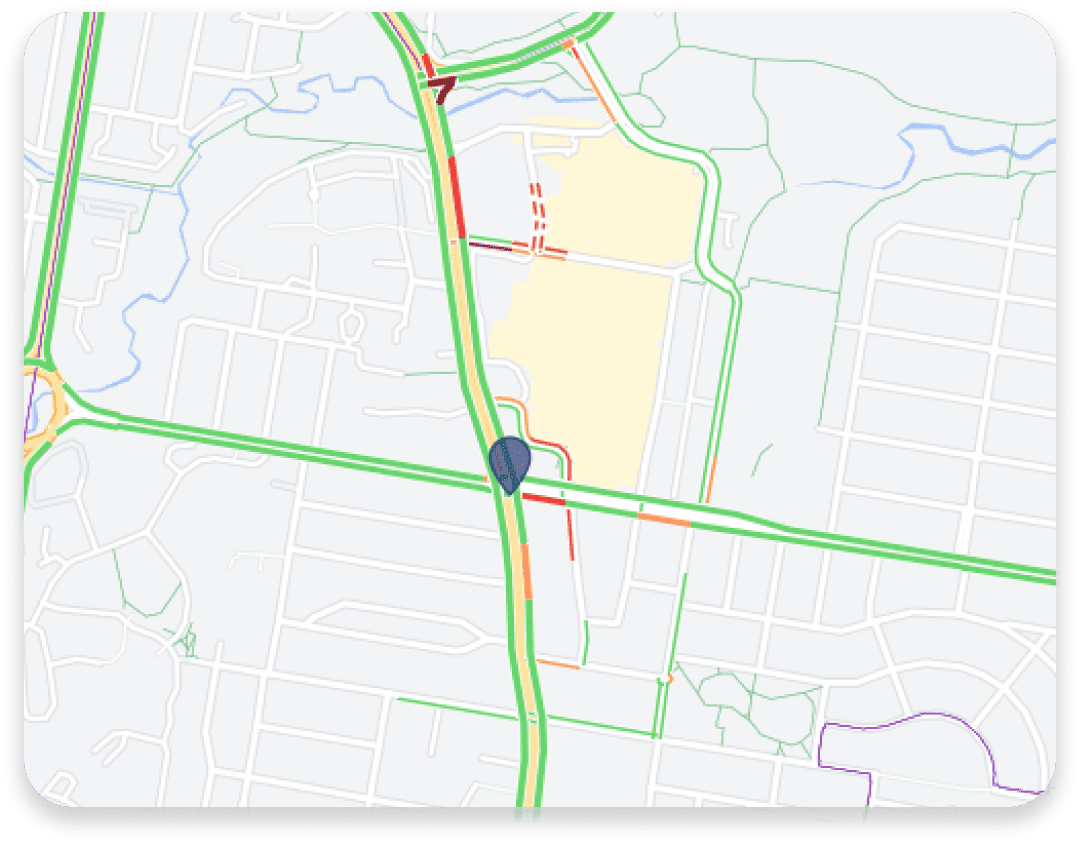
Overlaying live traffic data on your maps with Mapulus can provide real-time information on traffic flow and congestion in your area. This information can be particularly useful for businesses that rely on transportation, such as logistics and delivery companies. By monitoring live traffic conditions, you can adjust your routes and schedules in real-time to avoid any potential delays or disruptions.
Live traffic data can also be useful for businesses that have a physical storefront, such as retail or restaurants. By staying up-to-date on traffic conditions in your area, you can better plan for peak traffic times and adjust your staffing or inventory levels accordingly.
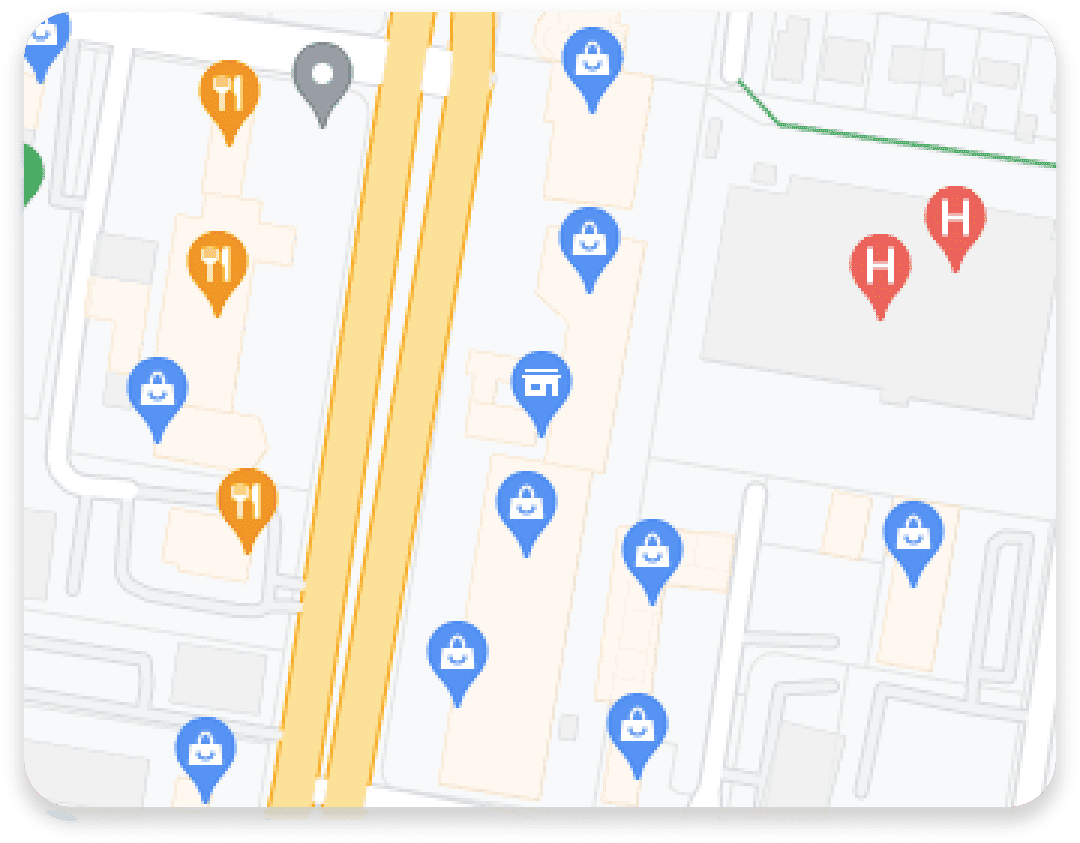
Mapulus allows you to easily visualise points of interest on your maps, including businesses, tourist locations. By adding this overlay to your maps, you can gain a better understanding of the areas in which you operate, and identify potential opportunities for growth and expansion.
Our points of interest overlay is constantly updated with the latest information, so you can rely on accurate and up-to-date data.
Highlighting Transit Corridors on your Mapulus map allows you to gain a deeper understanding of the public transportation options in your area. This overlay displays detailed routes, stops or trains, and other public transit (depending on your location). By visualising this data on your map, you can quickly identify areas that are well-served by public transportation.