Blog > The Odyssey of Daily Commutes
David Herse | June 14, 2023
The Odyssey of Daily Commutes: Exploring the Unseen Forces Behind Our Urban Race.
How does your daily commute feel? Is it a painstaking expedition, a ceaseless crawl where every meter gained feels like conquering a mountain, inch by gruelling inch? Or is it more like a high-octane rally race, an adrenaline-infused tango through the urban maze, where every heartbeat syncs with the rhythm of revving engines?
Beyond the immediate journey, have you ever been intrigued by the roadmap that dictates our paths? Have you pondered how our routes are etched not just by concrete and asphalt but by the unseen hands of city infrastructure, topography, and the time-faded strokes of historic urban planning? If not, fasten your seatbelt and allow us to navigate you through the fascinating interplay of elements that choreograph our everyday odyssey.
Using population density, average speed, and the linear distances covered within set time frames, we’ve curated an illuminating analysis of Australian cities. We aim to find out which Australian cities offer the most comfortable cruise and, by extension, are more interconnected.
A Boundless Journey Begins
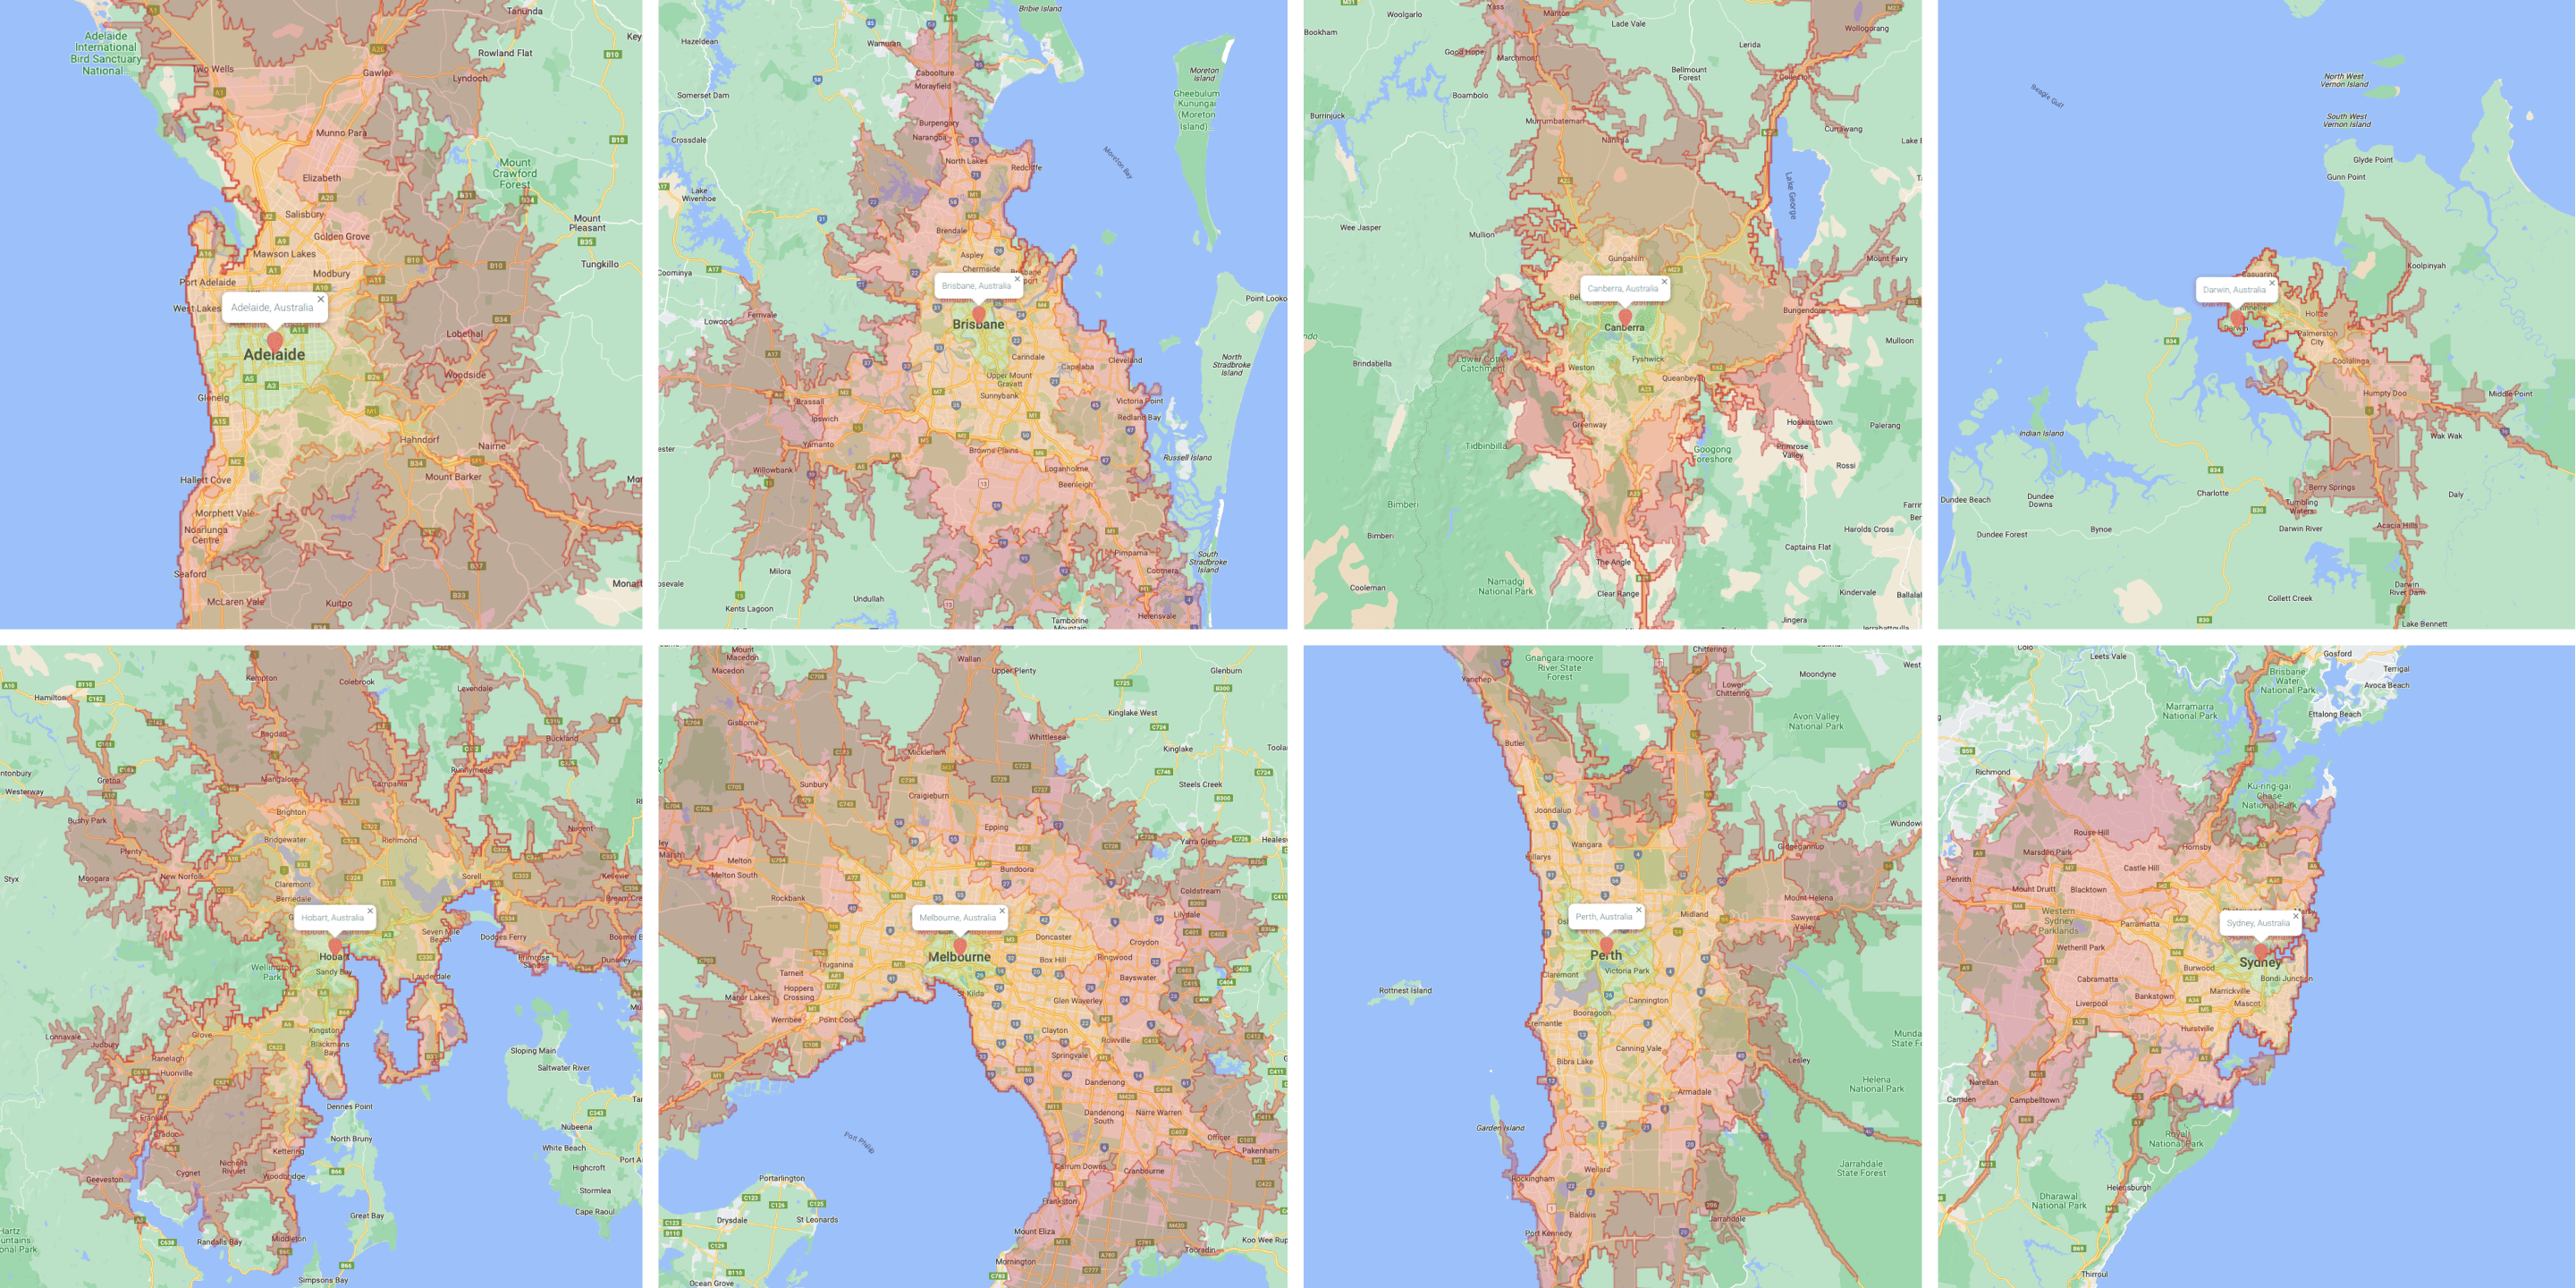
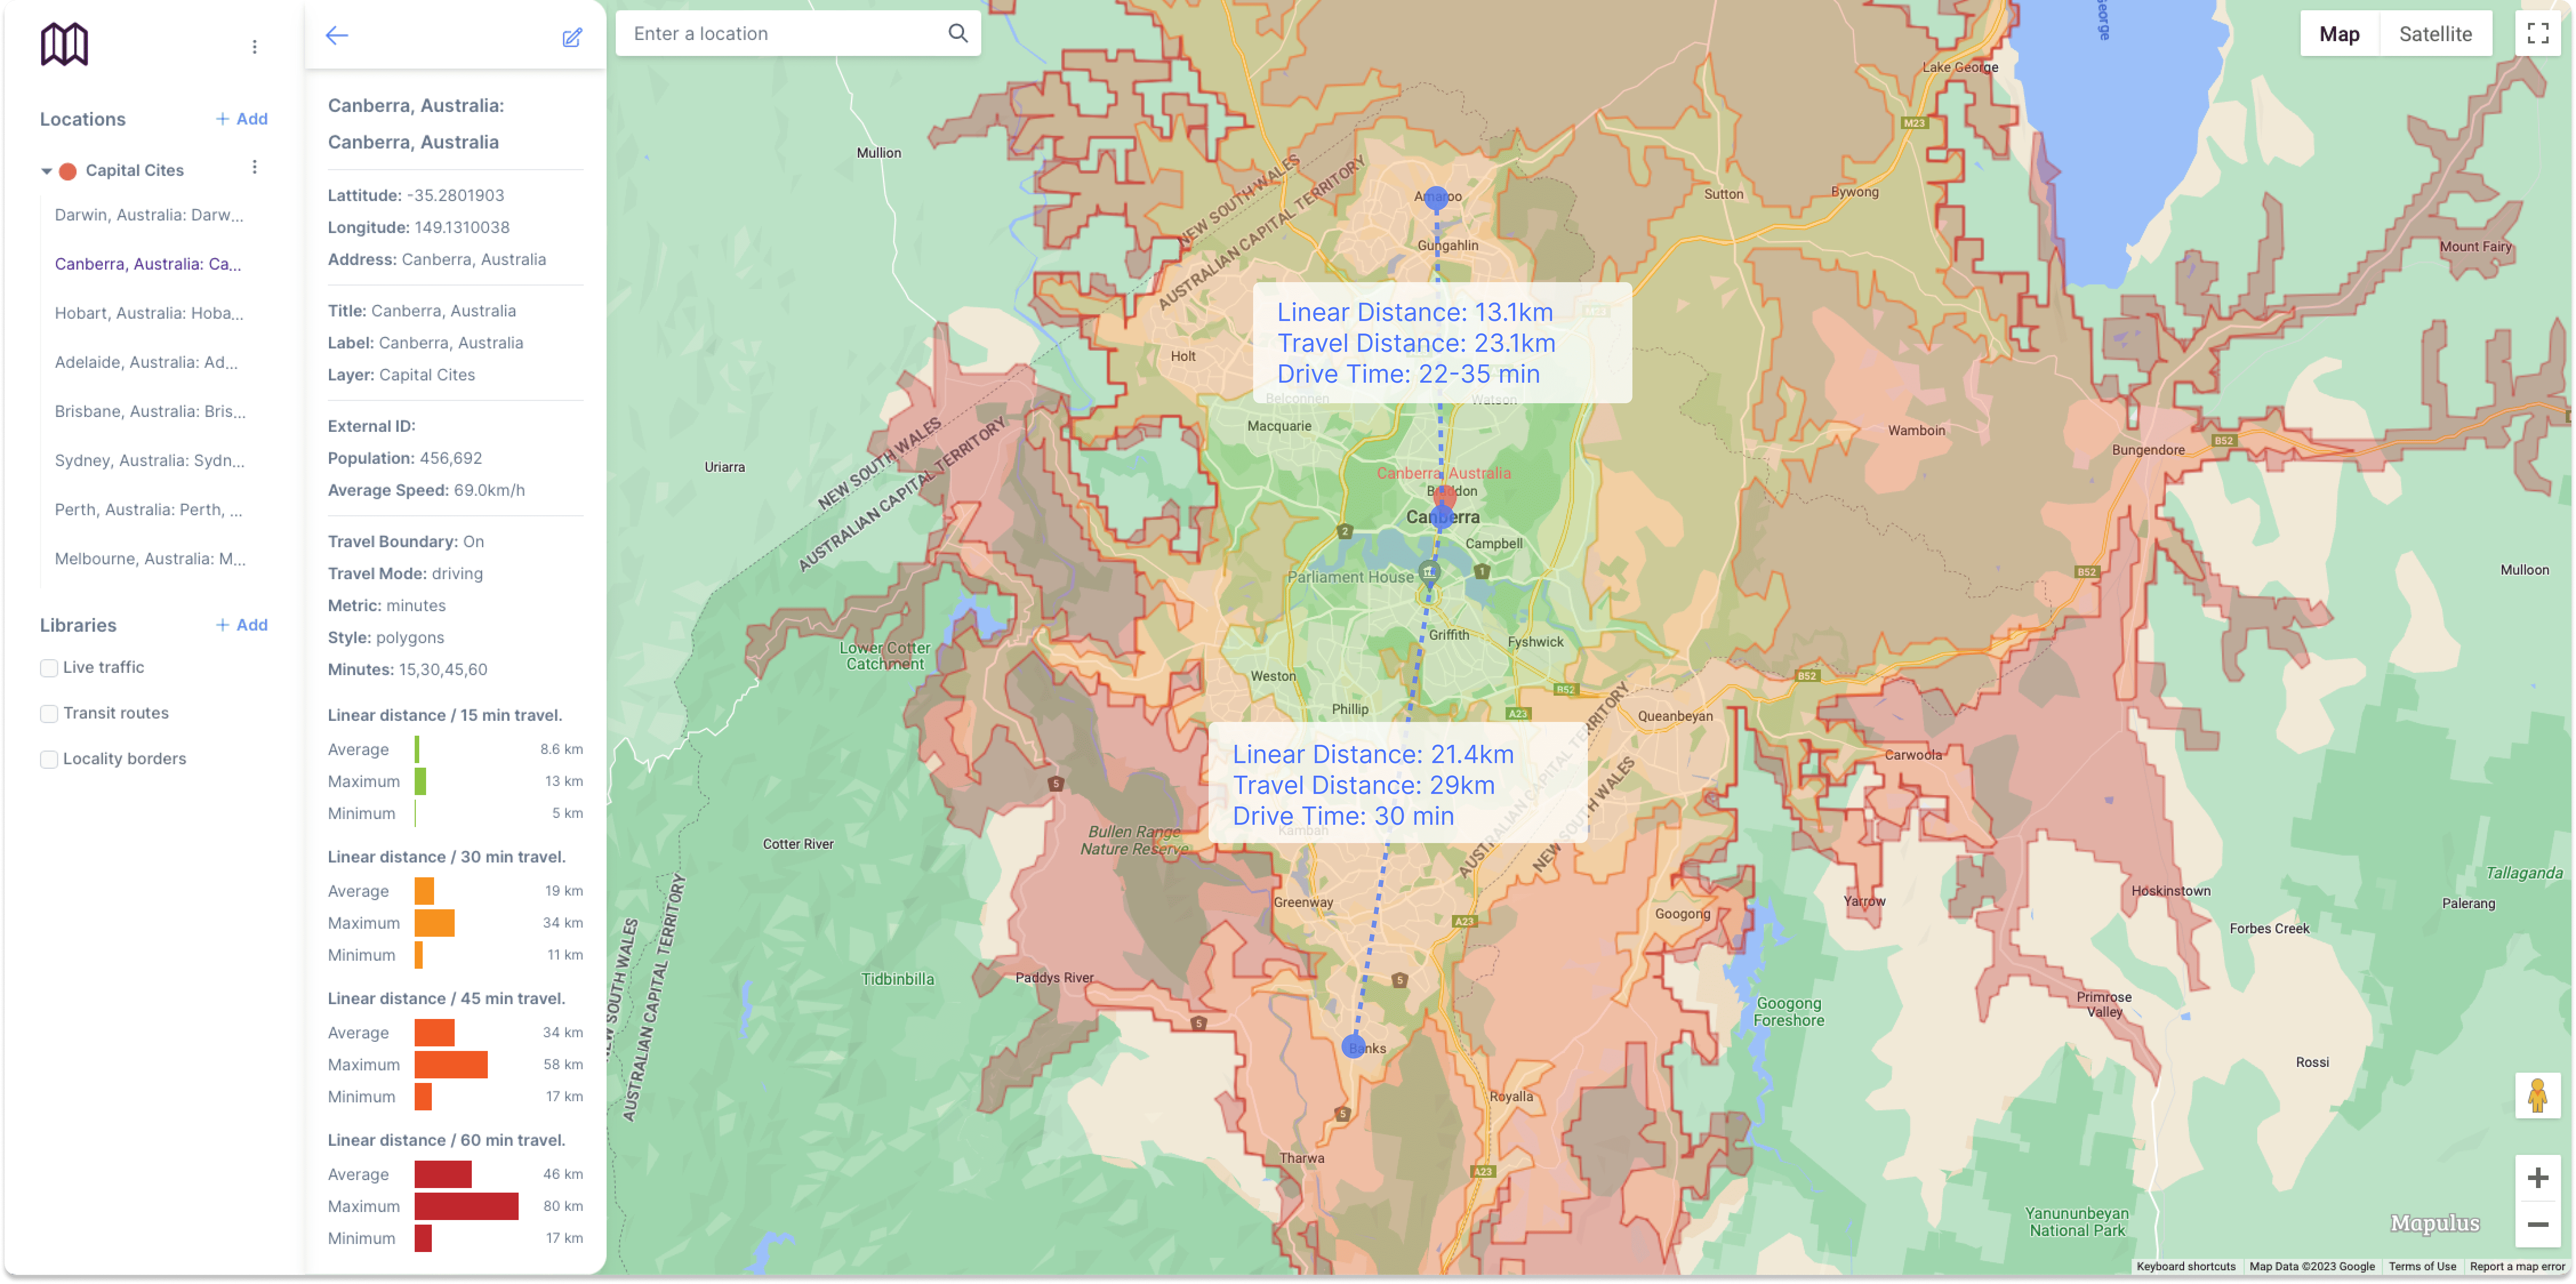
As we embarked on this journey, we first charted travel boundaries around the capital cities using 15, 30, 45, and 60 minutes travel boundary isochrones. This approach unlocked fascinating observable insights into drive times, geographical influences on driving patterns, and the impact on city connectedness and surrounding urban sprawls.
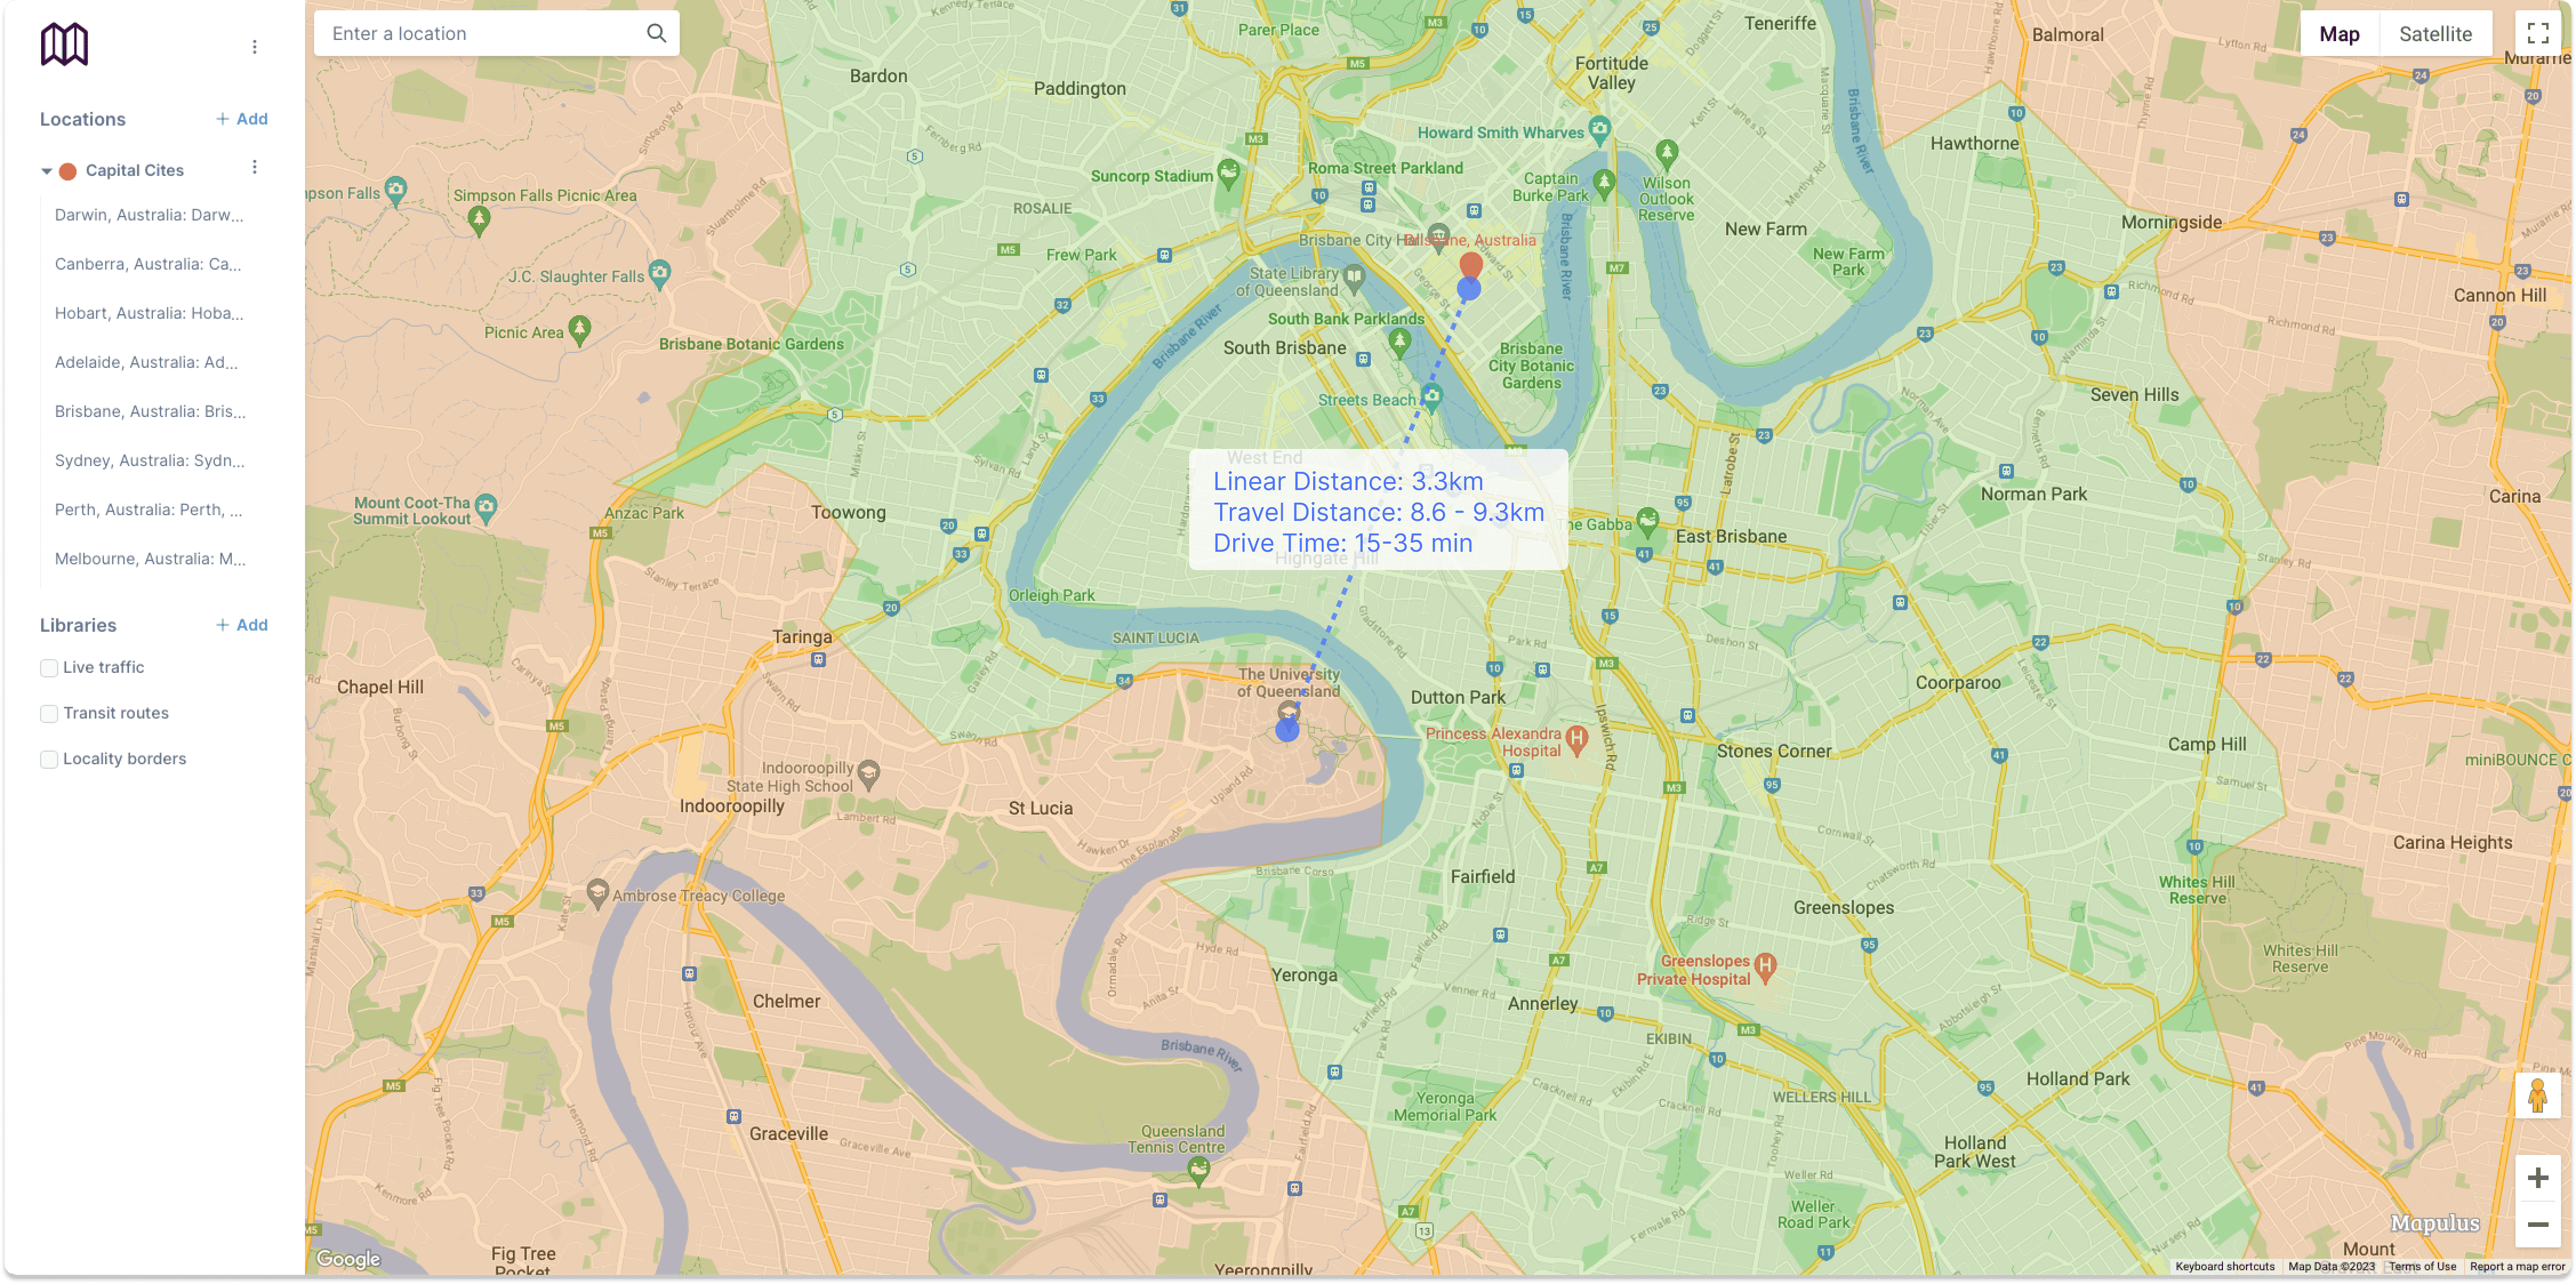
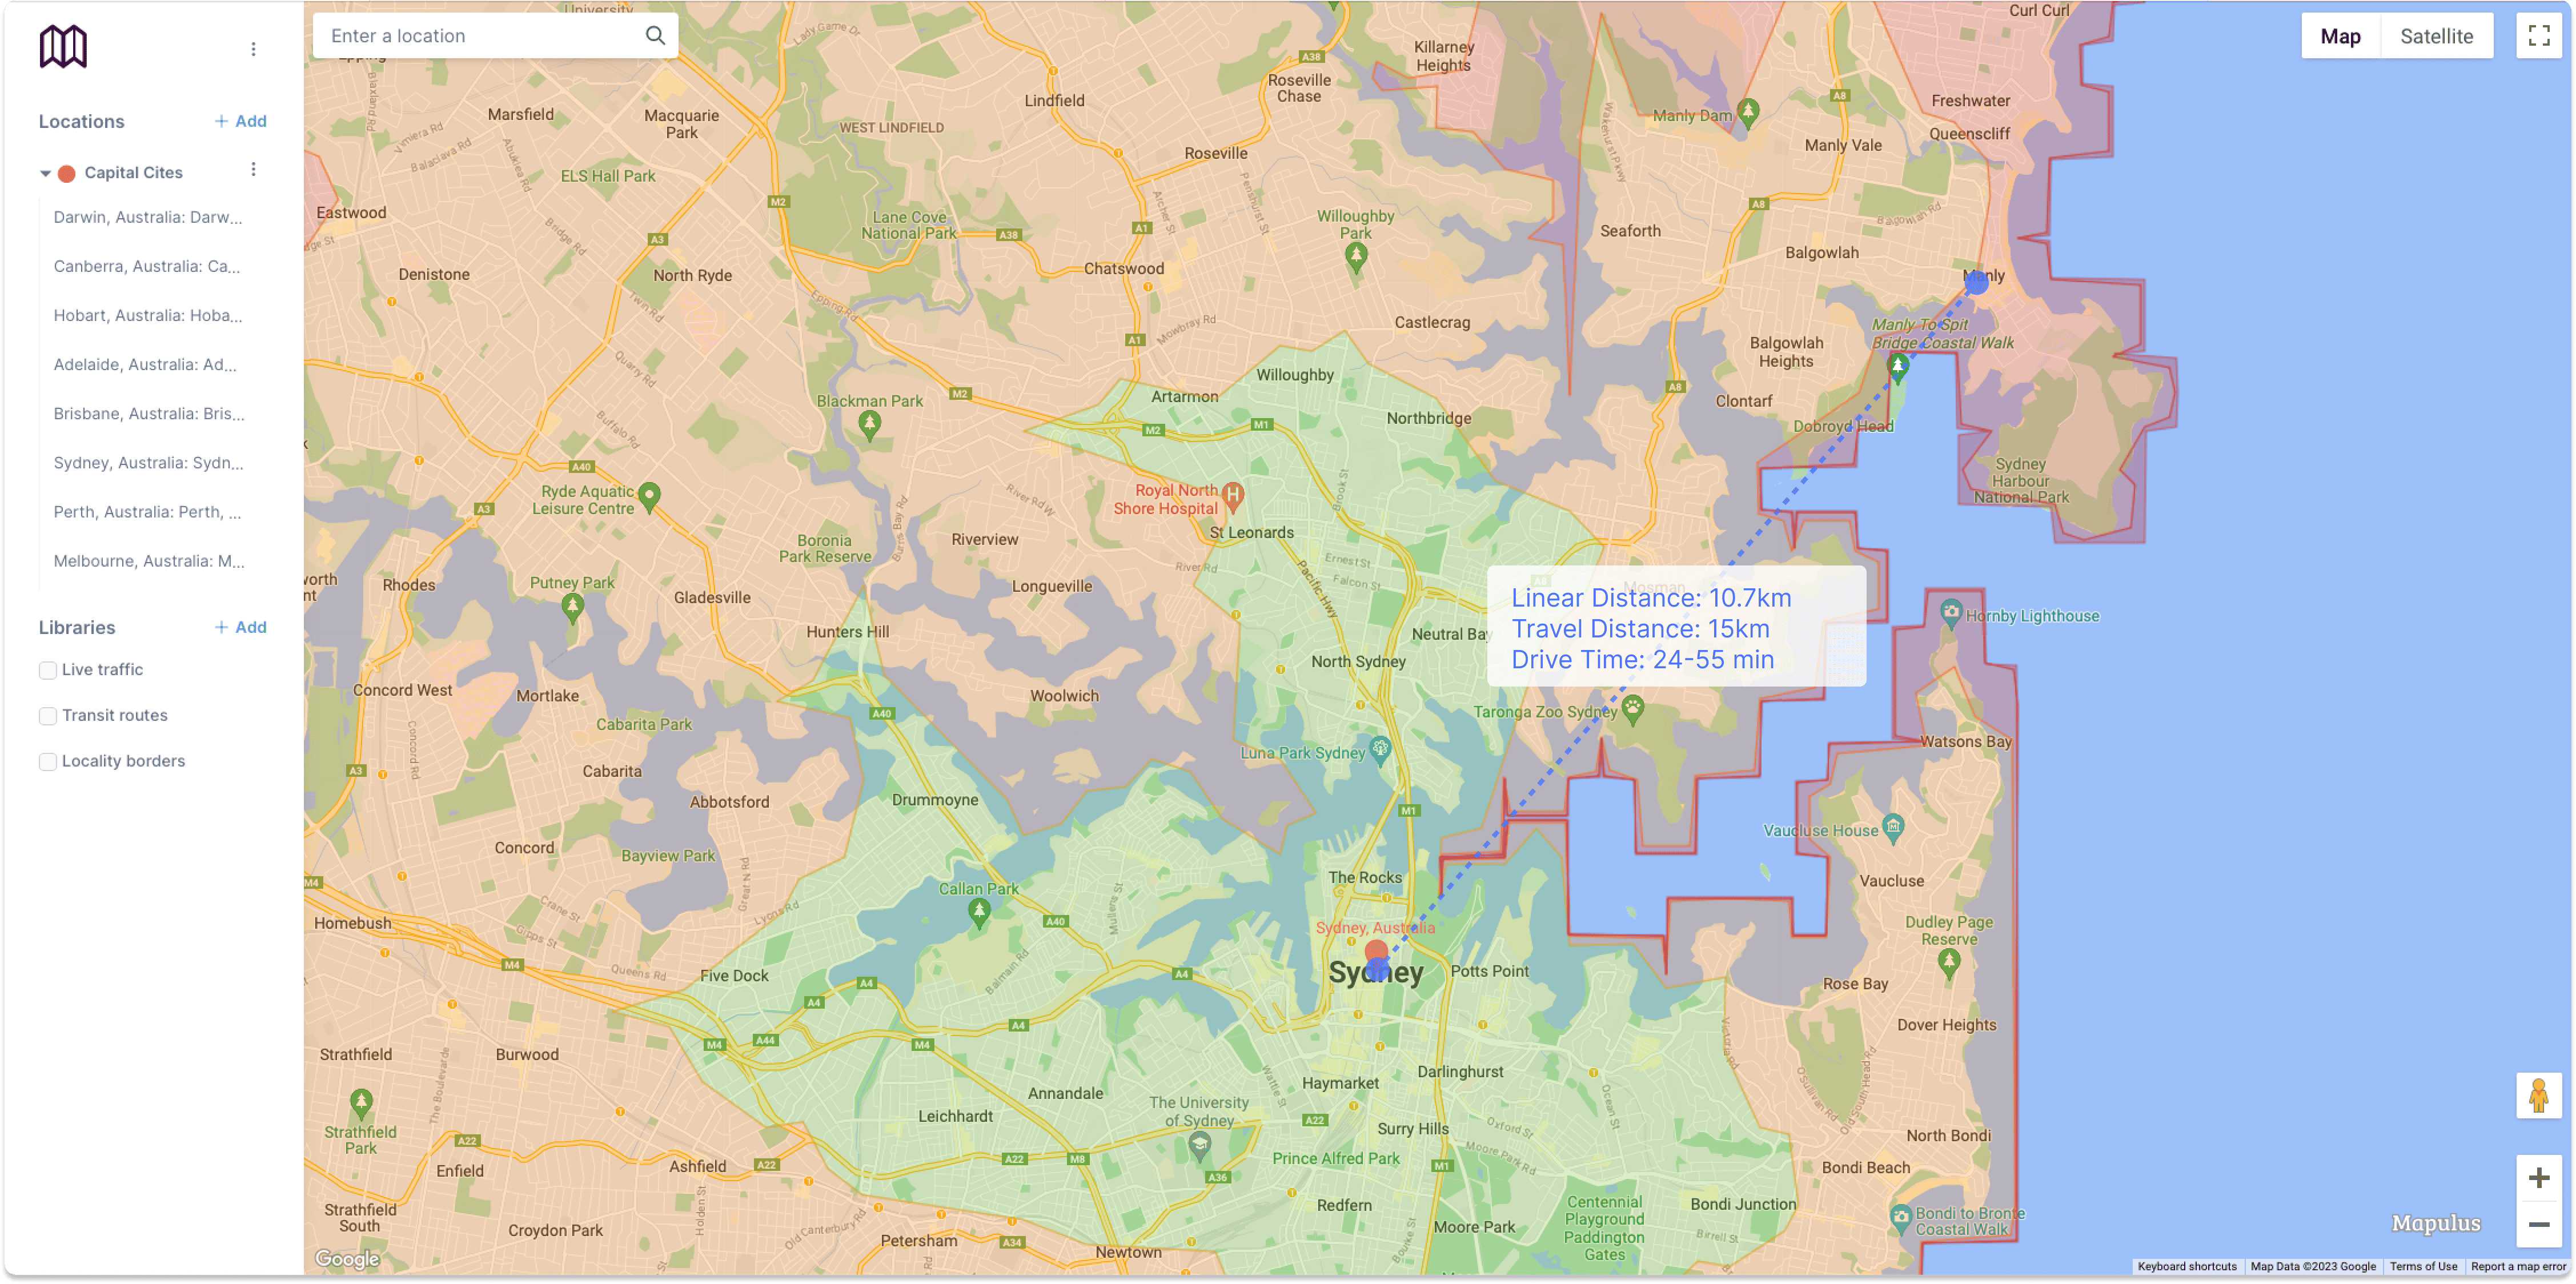
 Curious to see how this looks on a map. Step into the driver’s seat and steer your way over to Mapulus to experience this unique perspective for yourself with Mapulus.
In Brisbane, the picturesque river becomes an obstacle cutting a rigid boundary through the city, transforming, for example, commute times and travel behaviour in the western suburbs and influencing the city’s overall flow and connectivity. The hills and roads that follow old bullock trails create a dizzying chicane to your destination. Some studies have shown that (in what is a win for the environment) the lack of connections across the river in Brisbane causes more people to use public transport or cycle and walk when they need to cross the river. Likewise, a minimum 30-45-minute journey to Manly around the Sydney harbour barely covers 10 km as the crow flies, which is a serious speed bump in the city’s flow, but can be traversed faster and more consistently with a ferry.
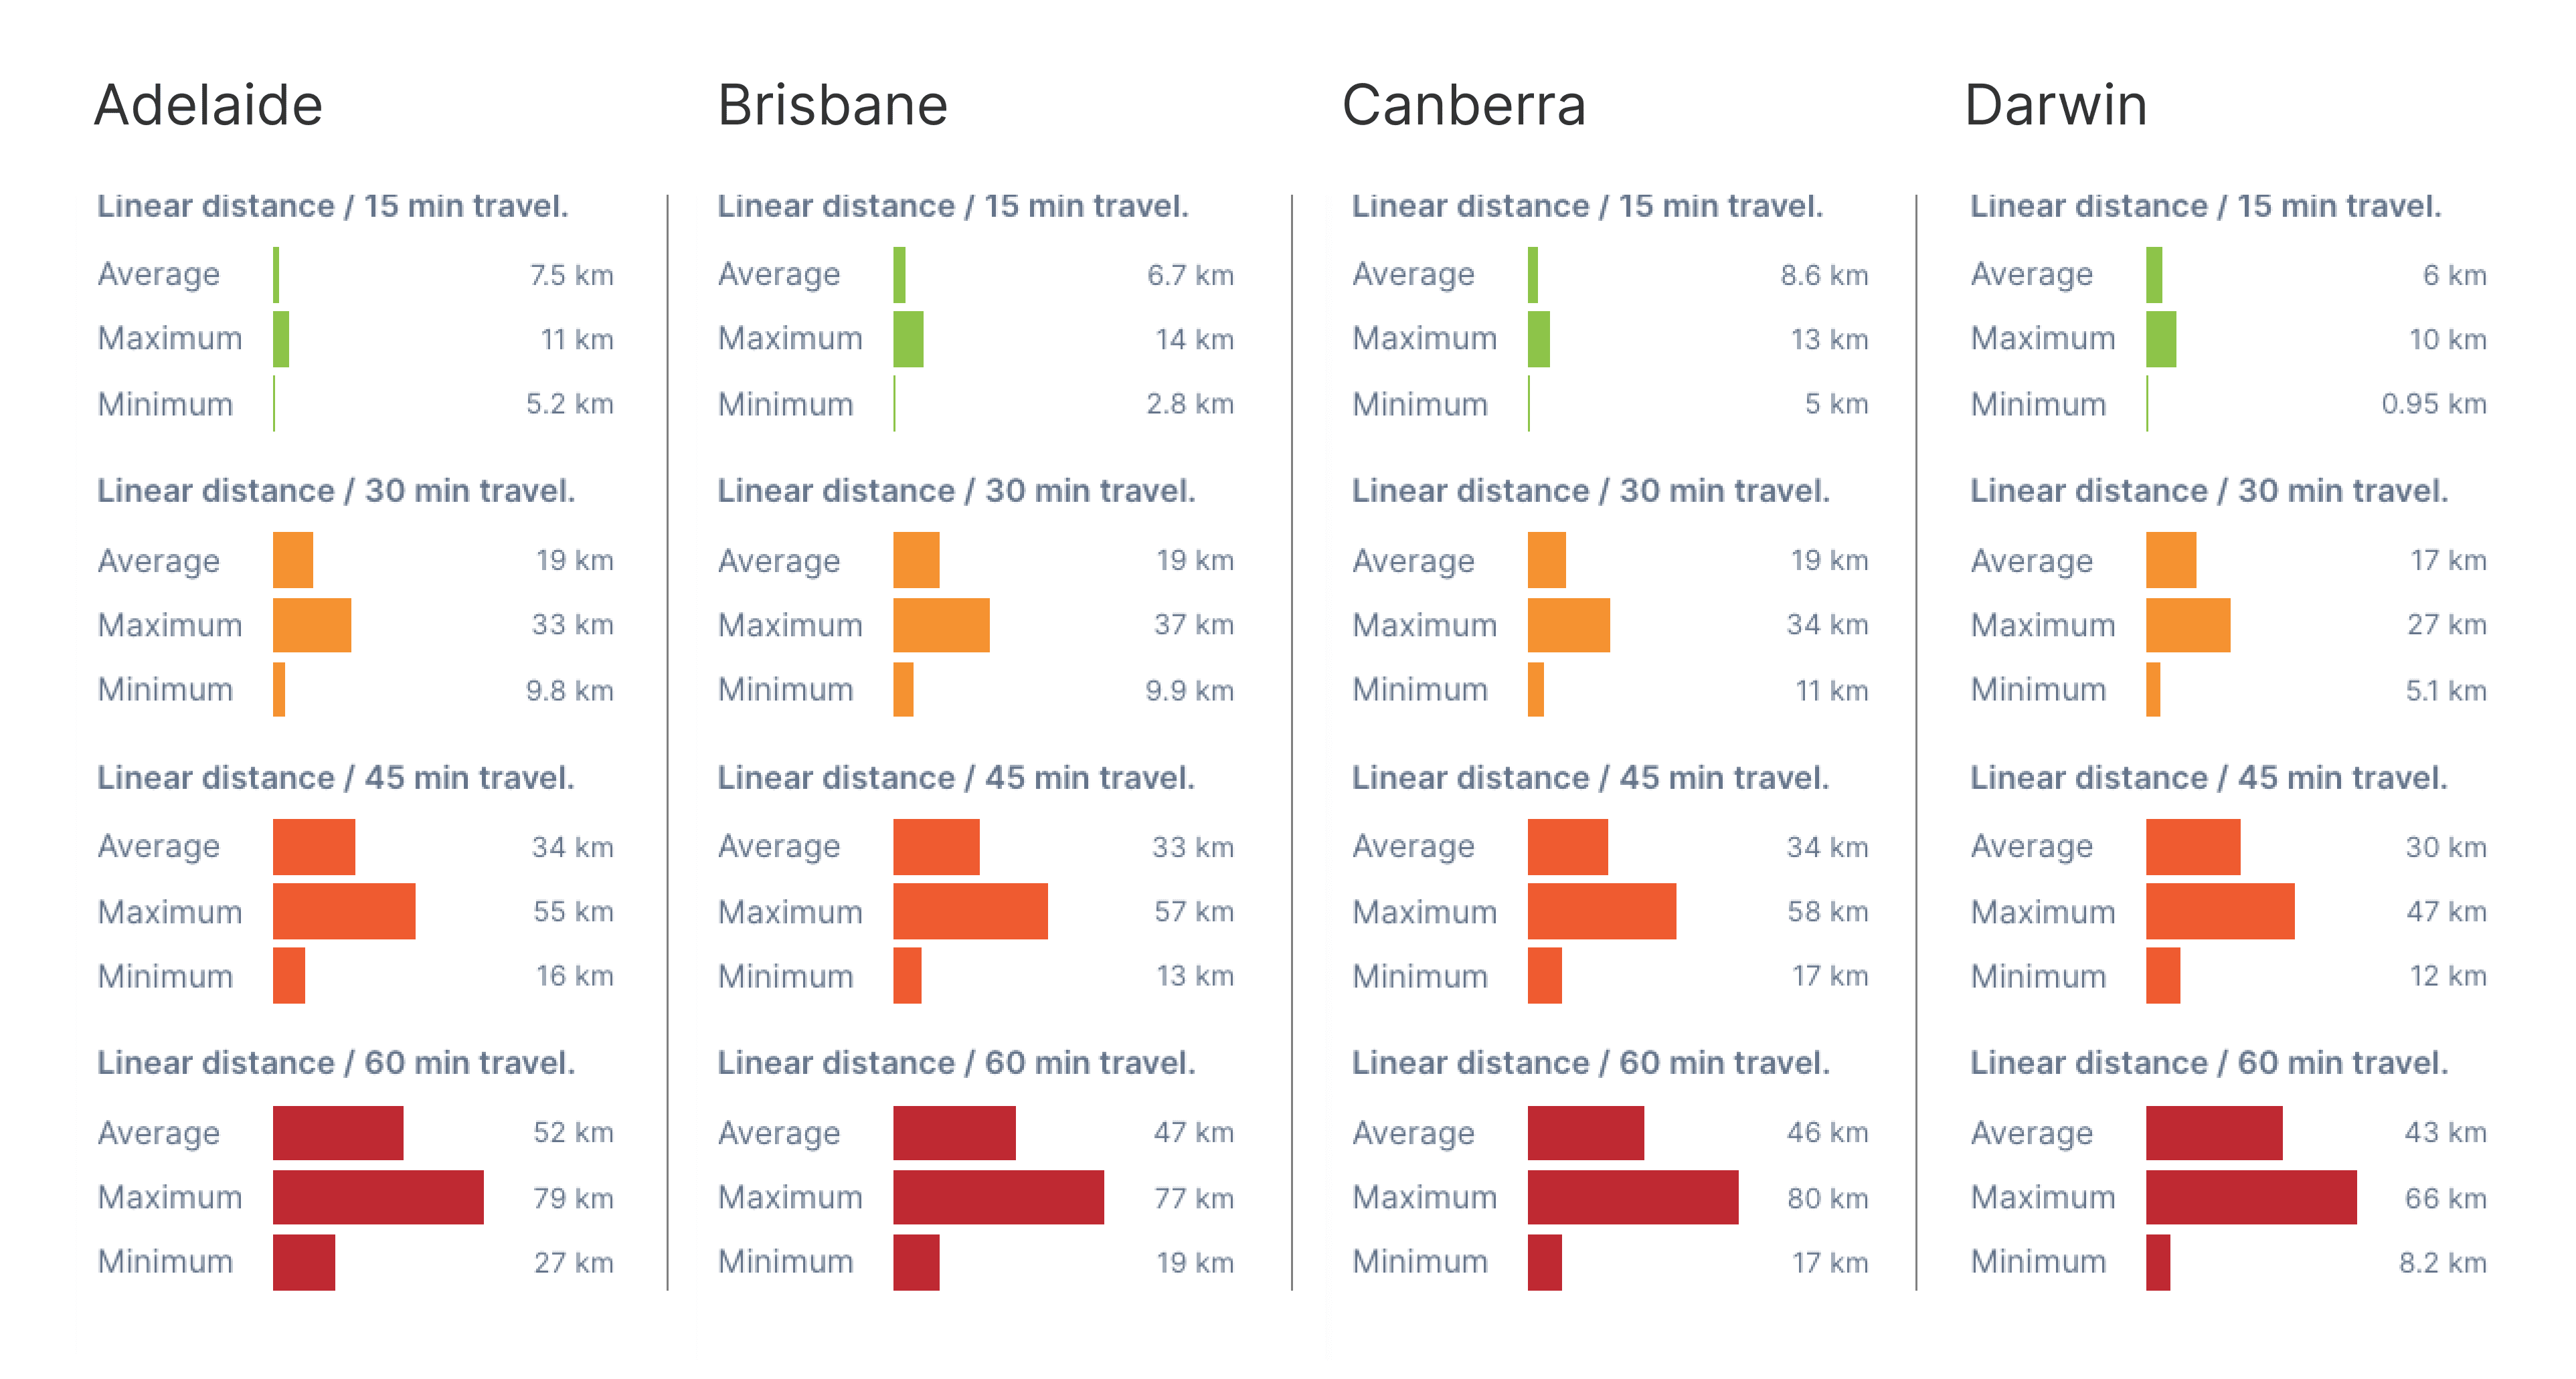
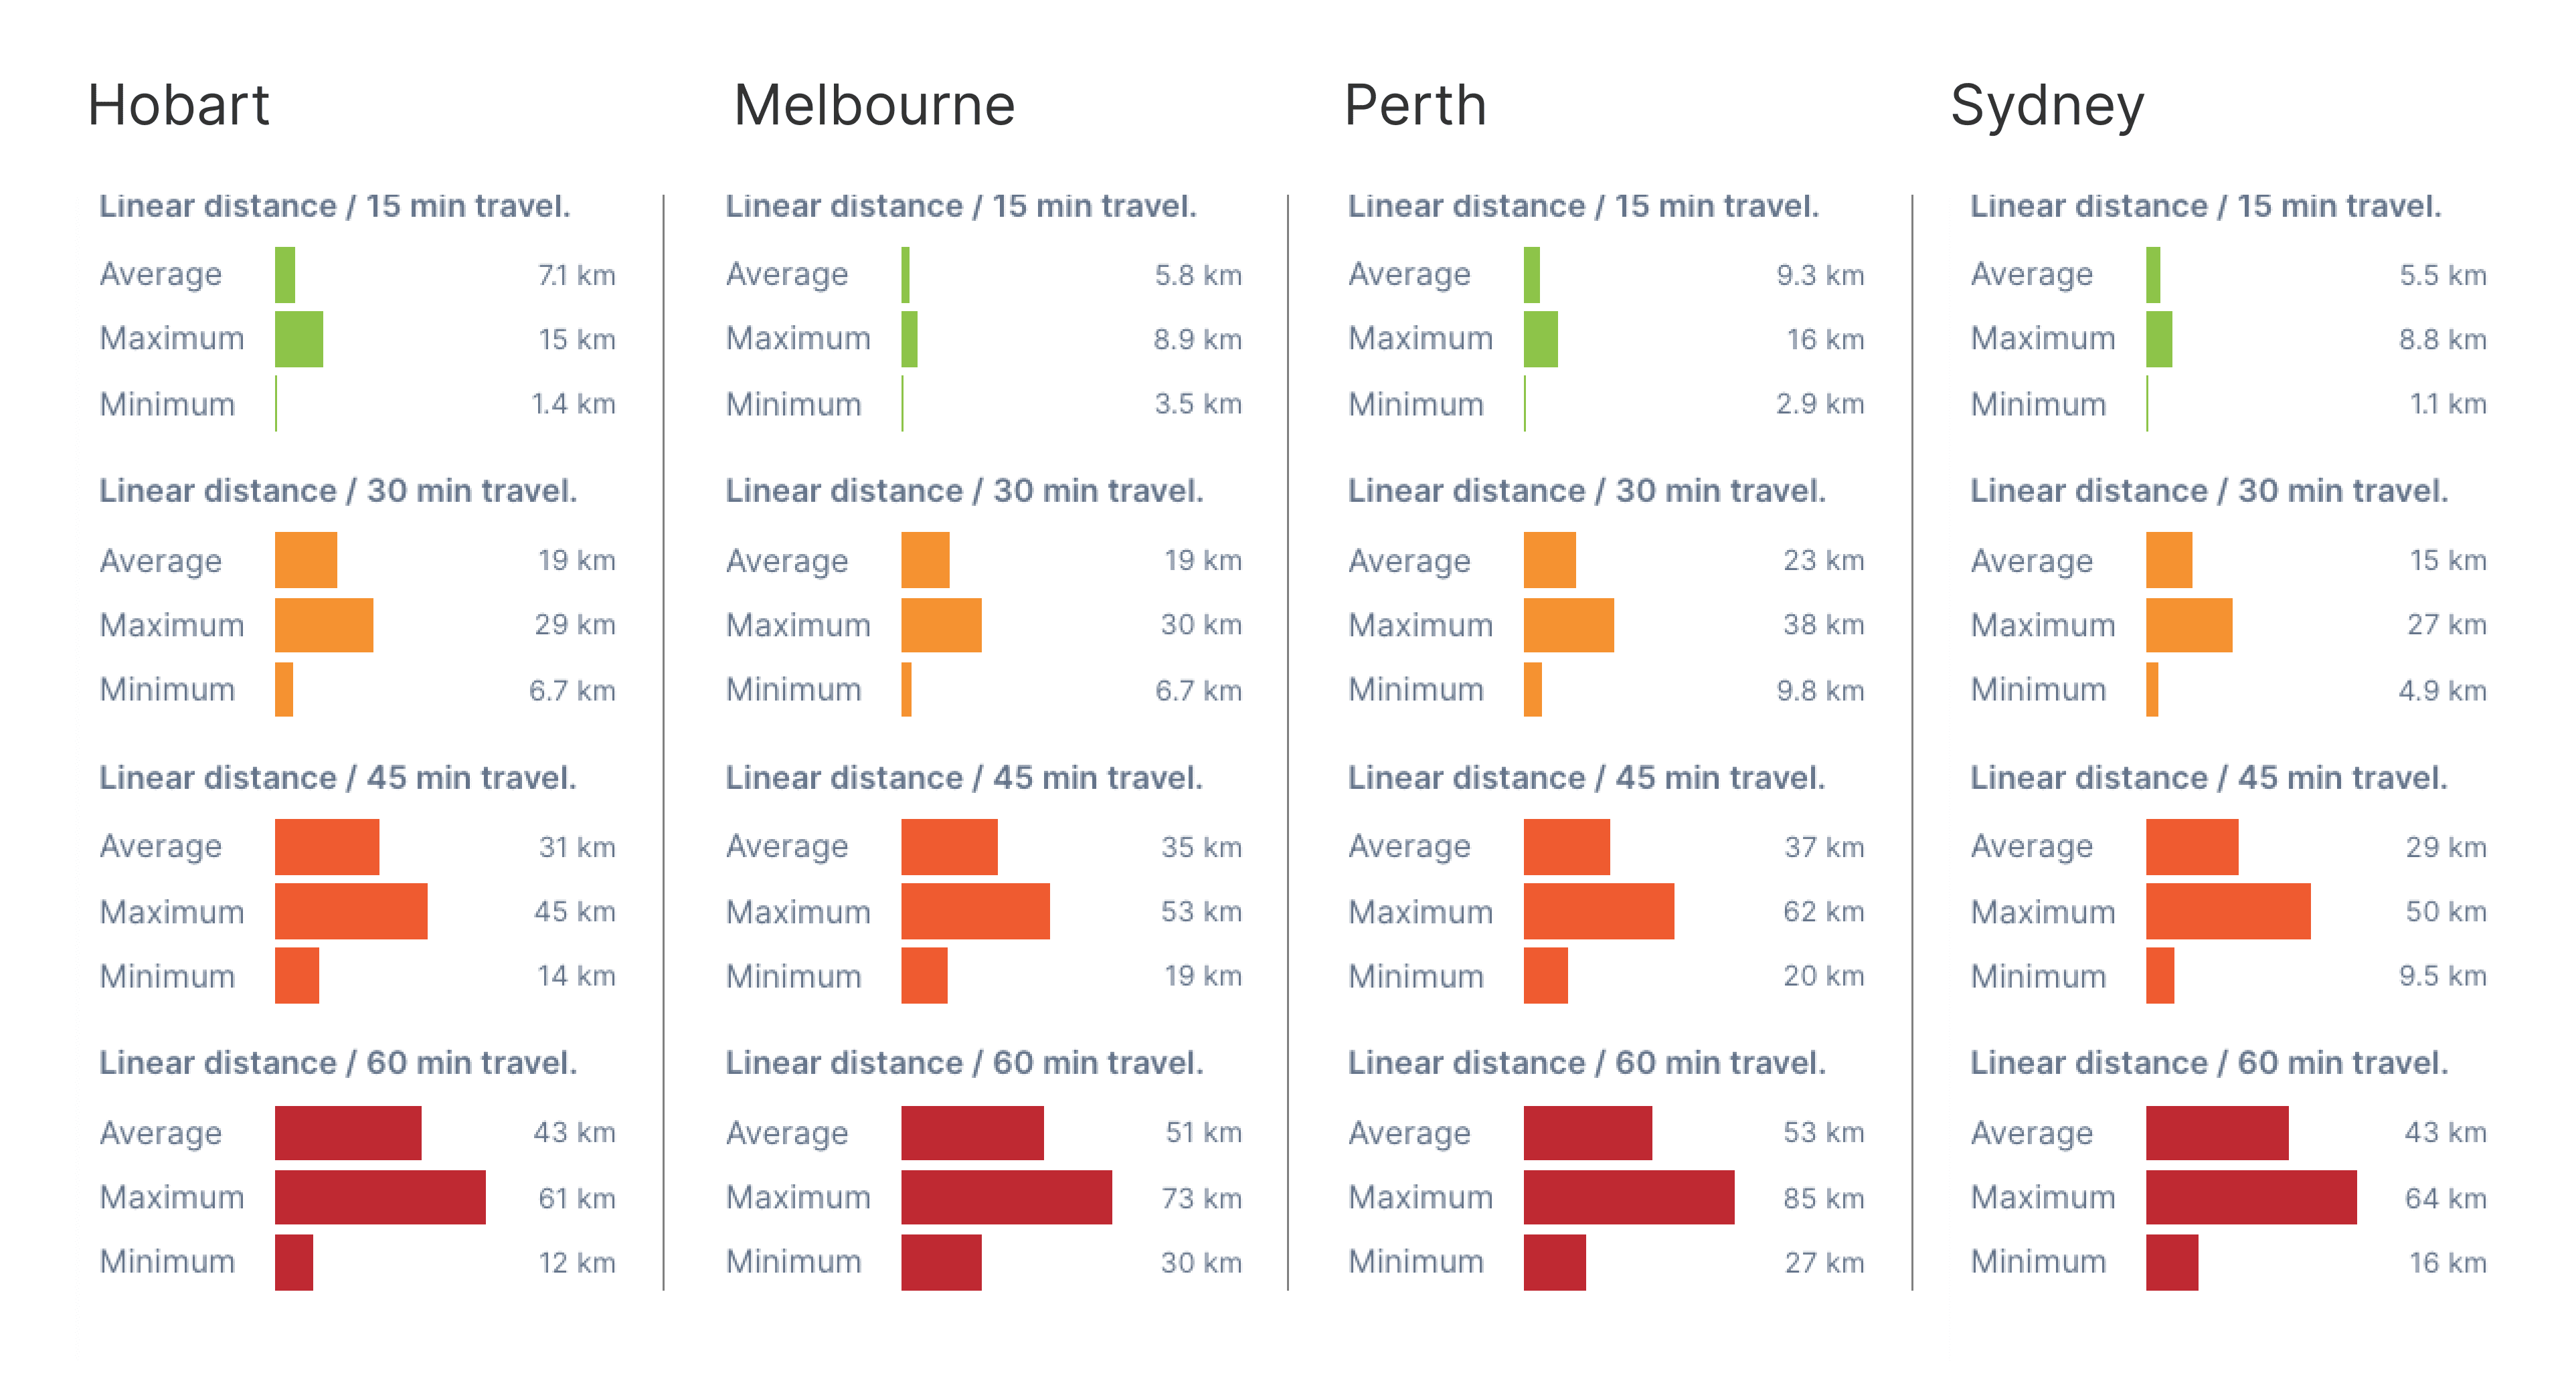
Linear Distance: A Measure of Urban Connectivity
Linear distance, the straight-line travel within a set time frame, offers a unique perspective on a city’s transportation fabric. It’s not about declaring a city as ‘good’ or ‘bad’; instead, it’s a barometer of a city’s connectivity.
Cities showing a more considerable linear distance indicate more direct routes and efficient traffic flows. On the other hand, shorter linear distances suggest densely populated areas with winding streets and obstacles. It’s essential to remember that these measures neither detract from nor enhance a city’s charm - they merely reflect the complexity and connectedness of its urban layout. It’s probably worth another study to investigate how a meandering city with hidden nooks might add to its charm and culture – but we’ll save that for another post.
The Scenic Route: Geographical Boundaries and High-Speed Arterial Roads
Using Mapulus travel boundaries, we shed light on the role of geographical boundaries and arterial roads on driving conditions. Let’s use Sydney as an example, where the M1 and M31 arterial roads, stretching towards Gosford and Helensburgh, respectively, are hemmed in by surrounding national parks. On the other hand, Brisbane’s unrestricted sprawl along its arterial roads offers an eye-opening contrast.
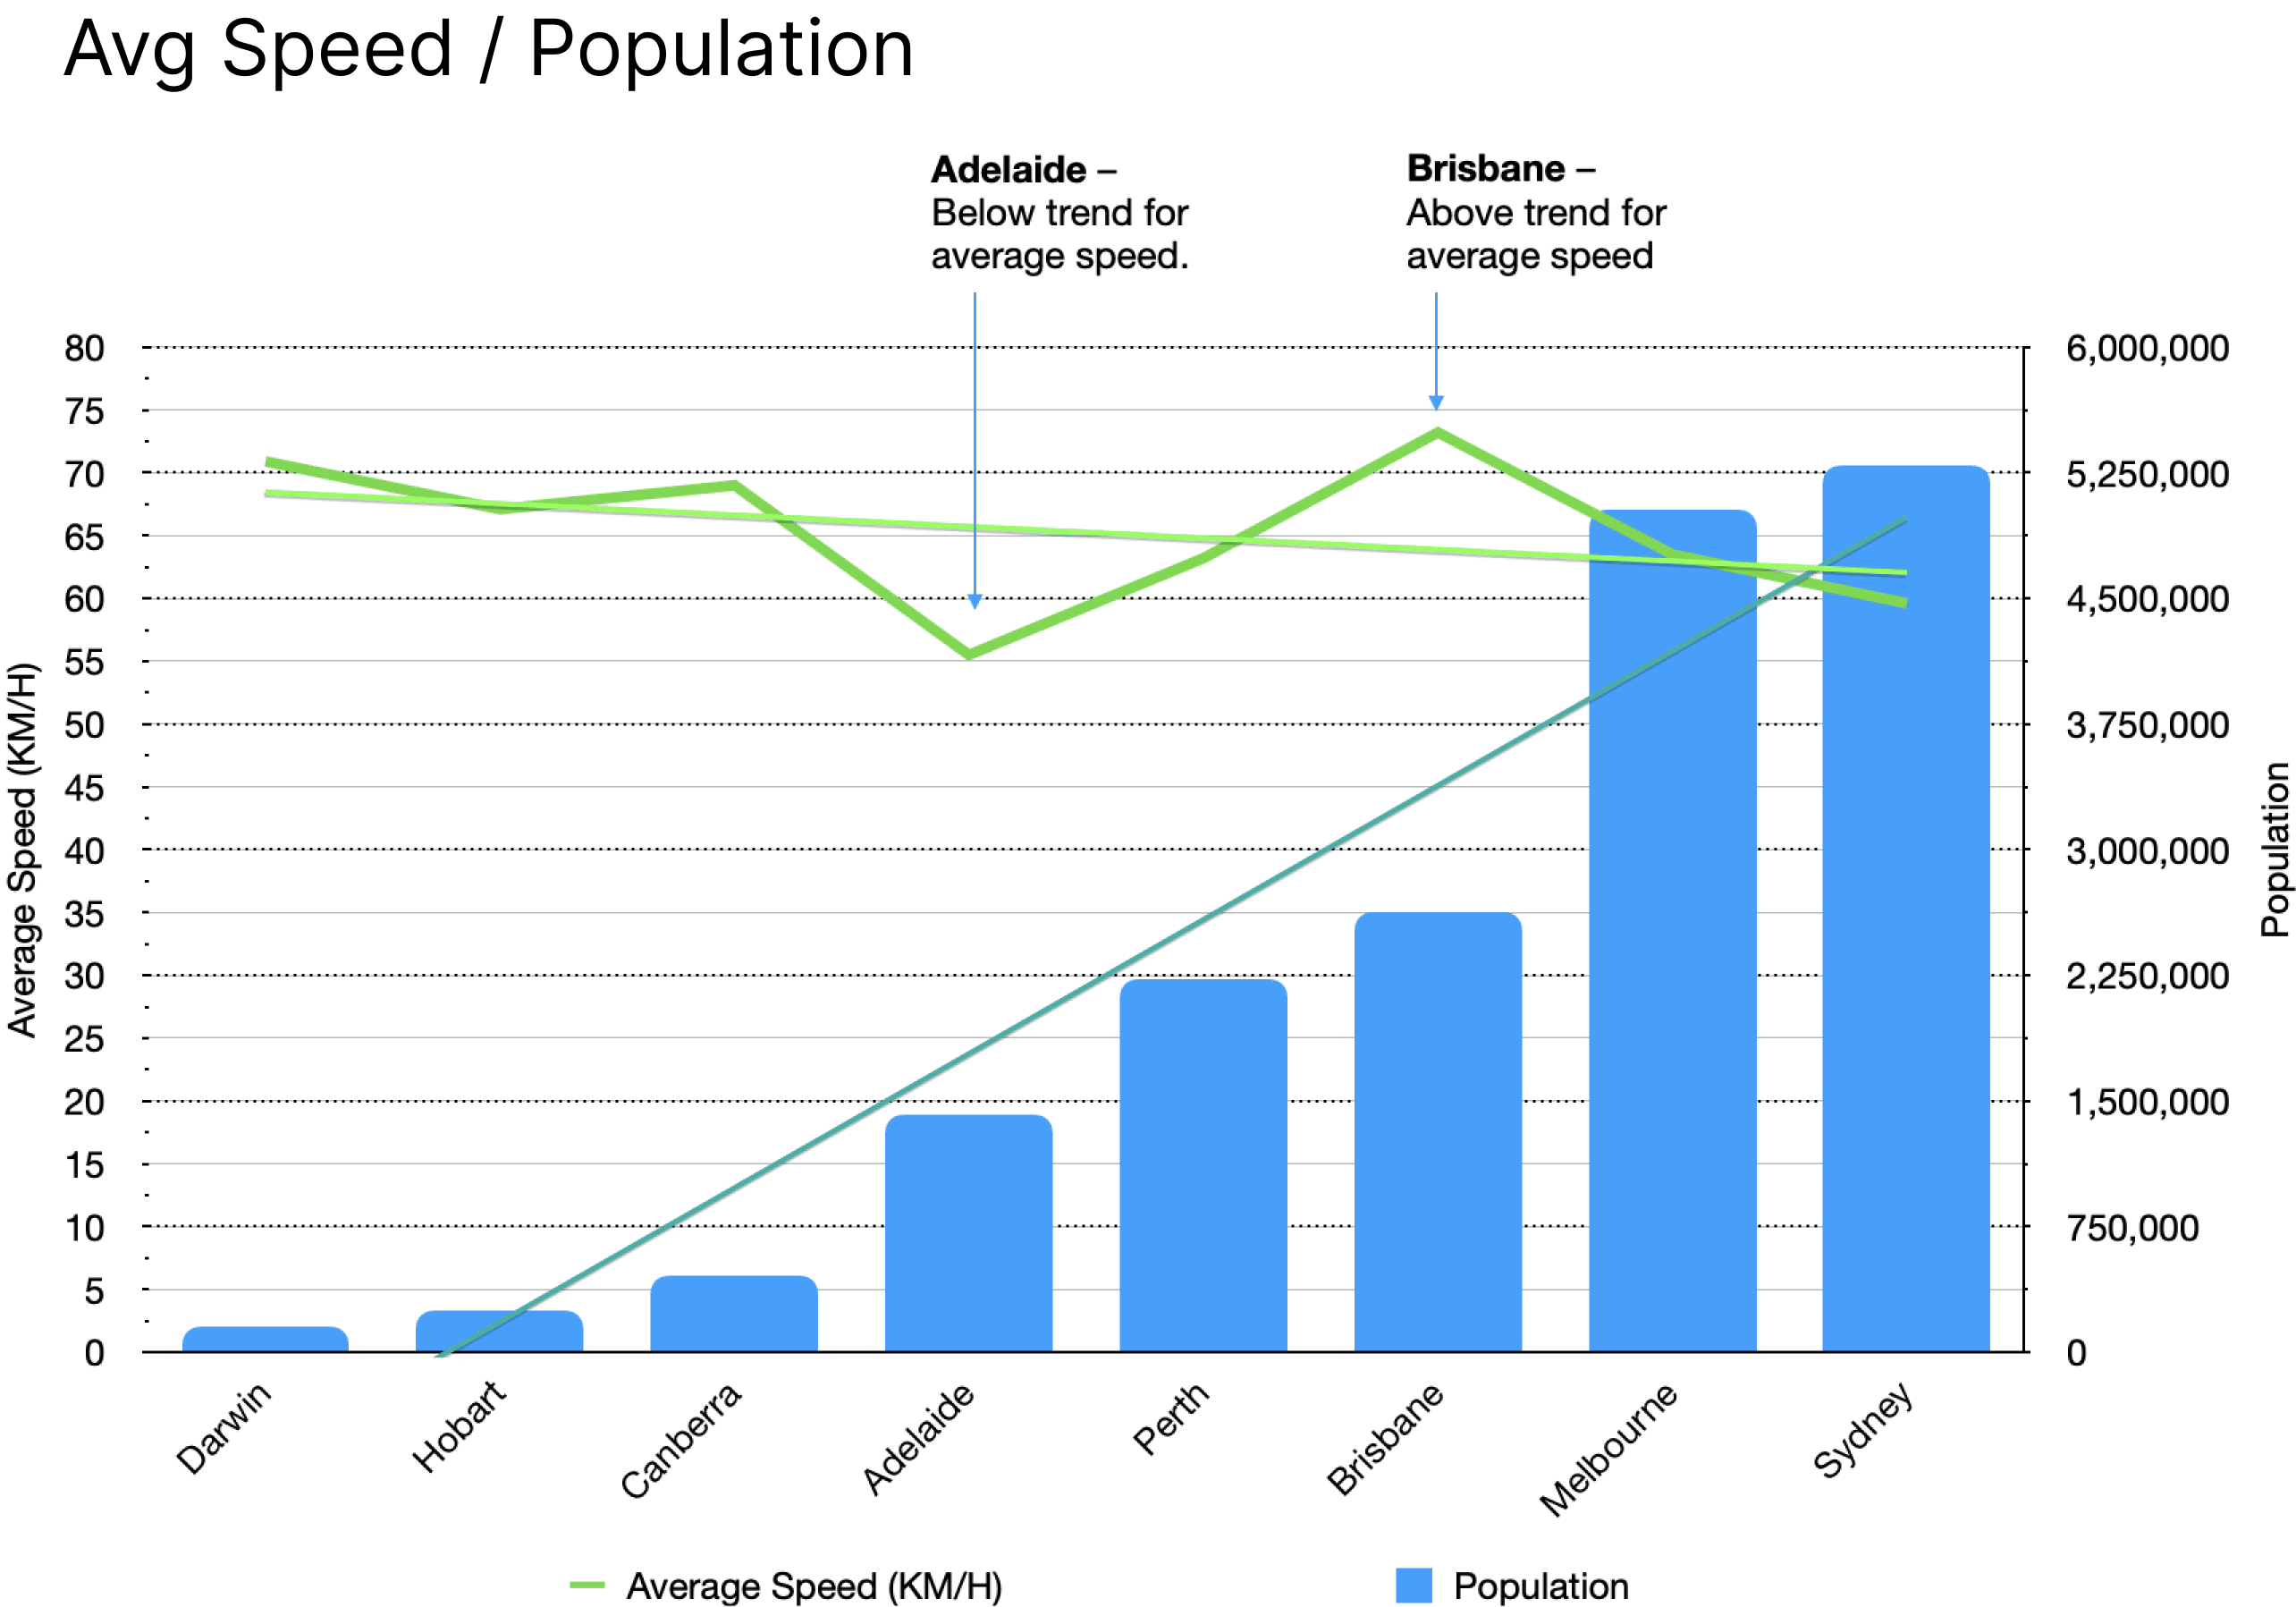
The Rush Hour Effect: Population’s Influence on Average Driving Speeds
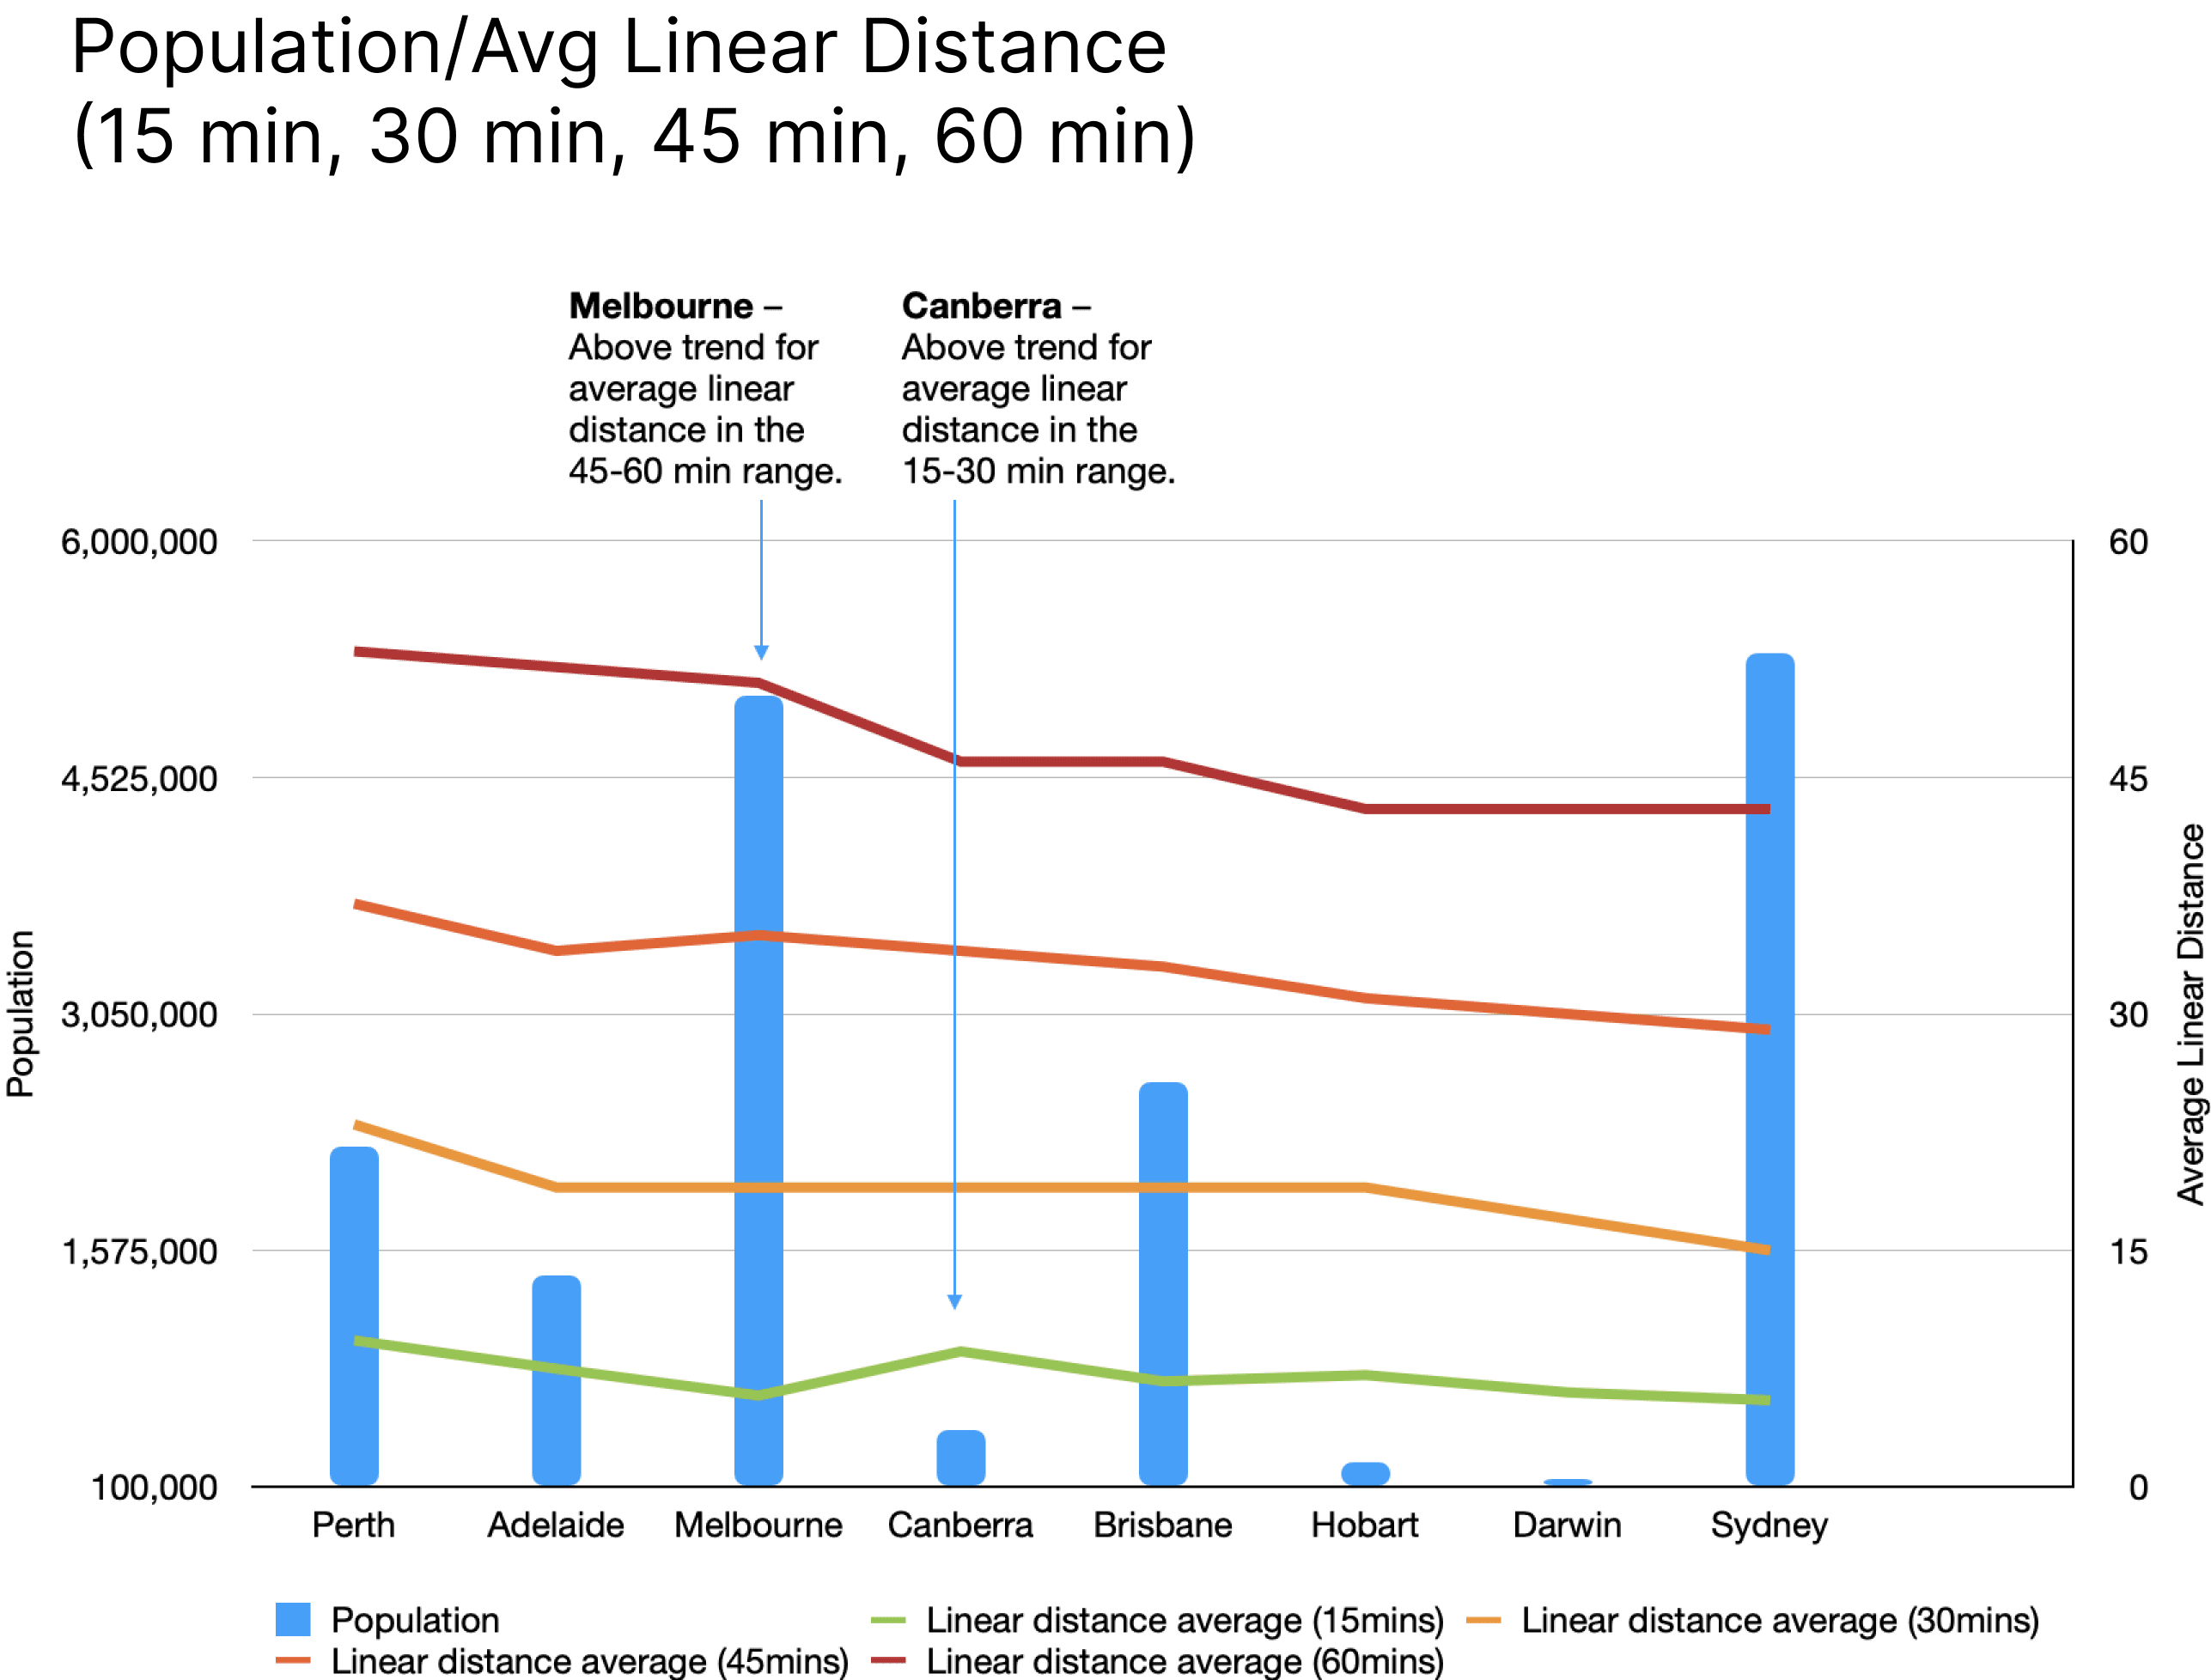
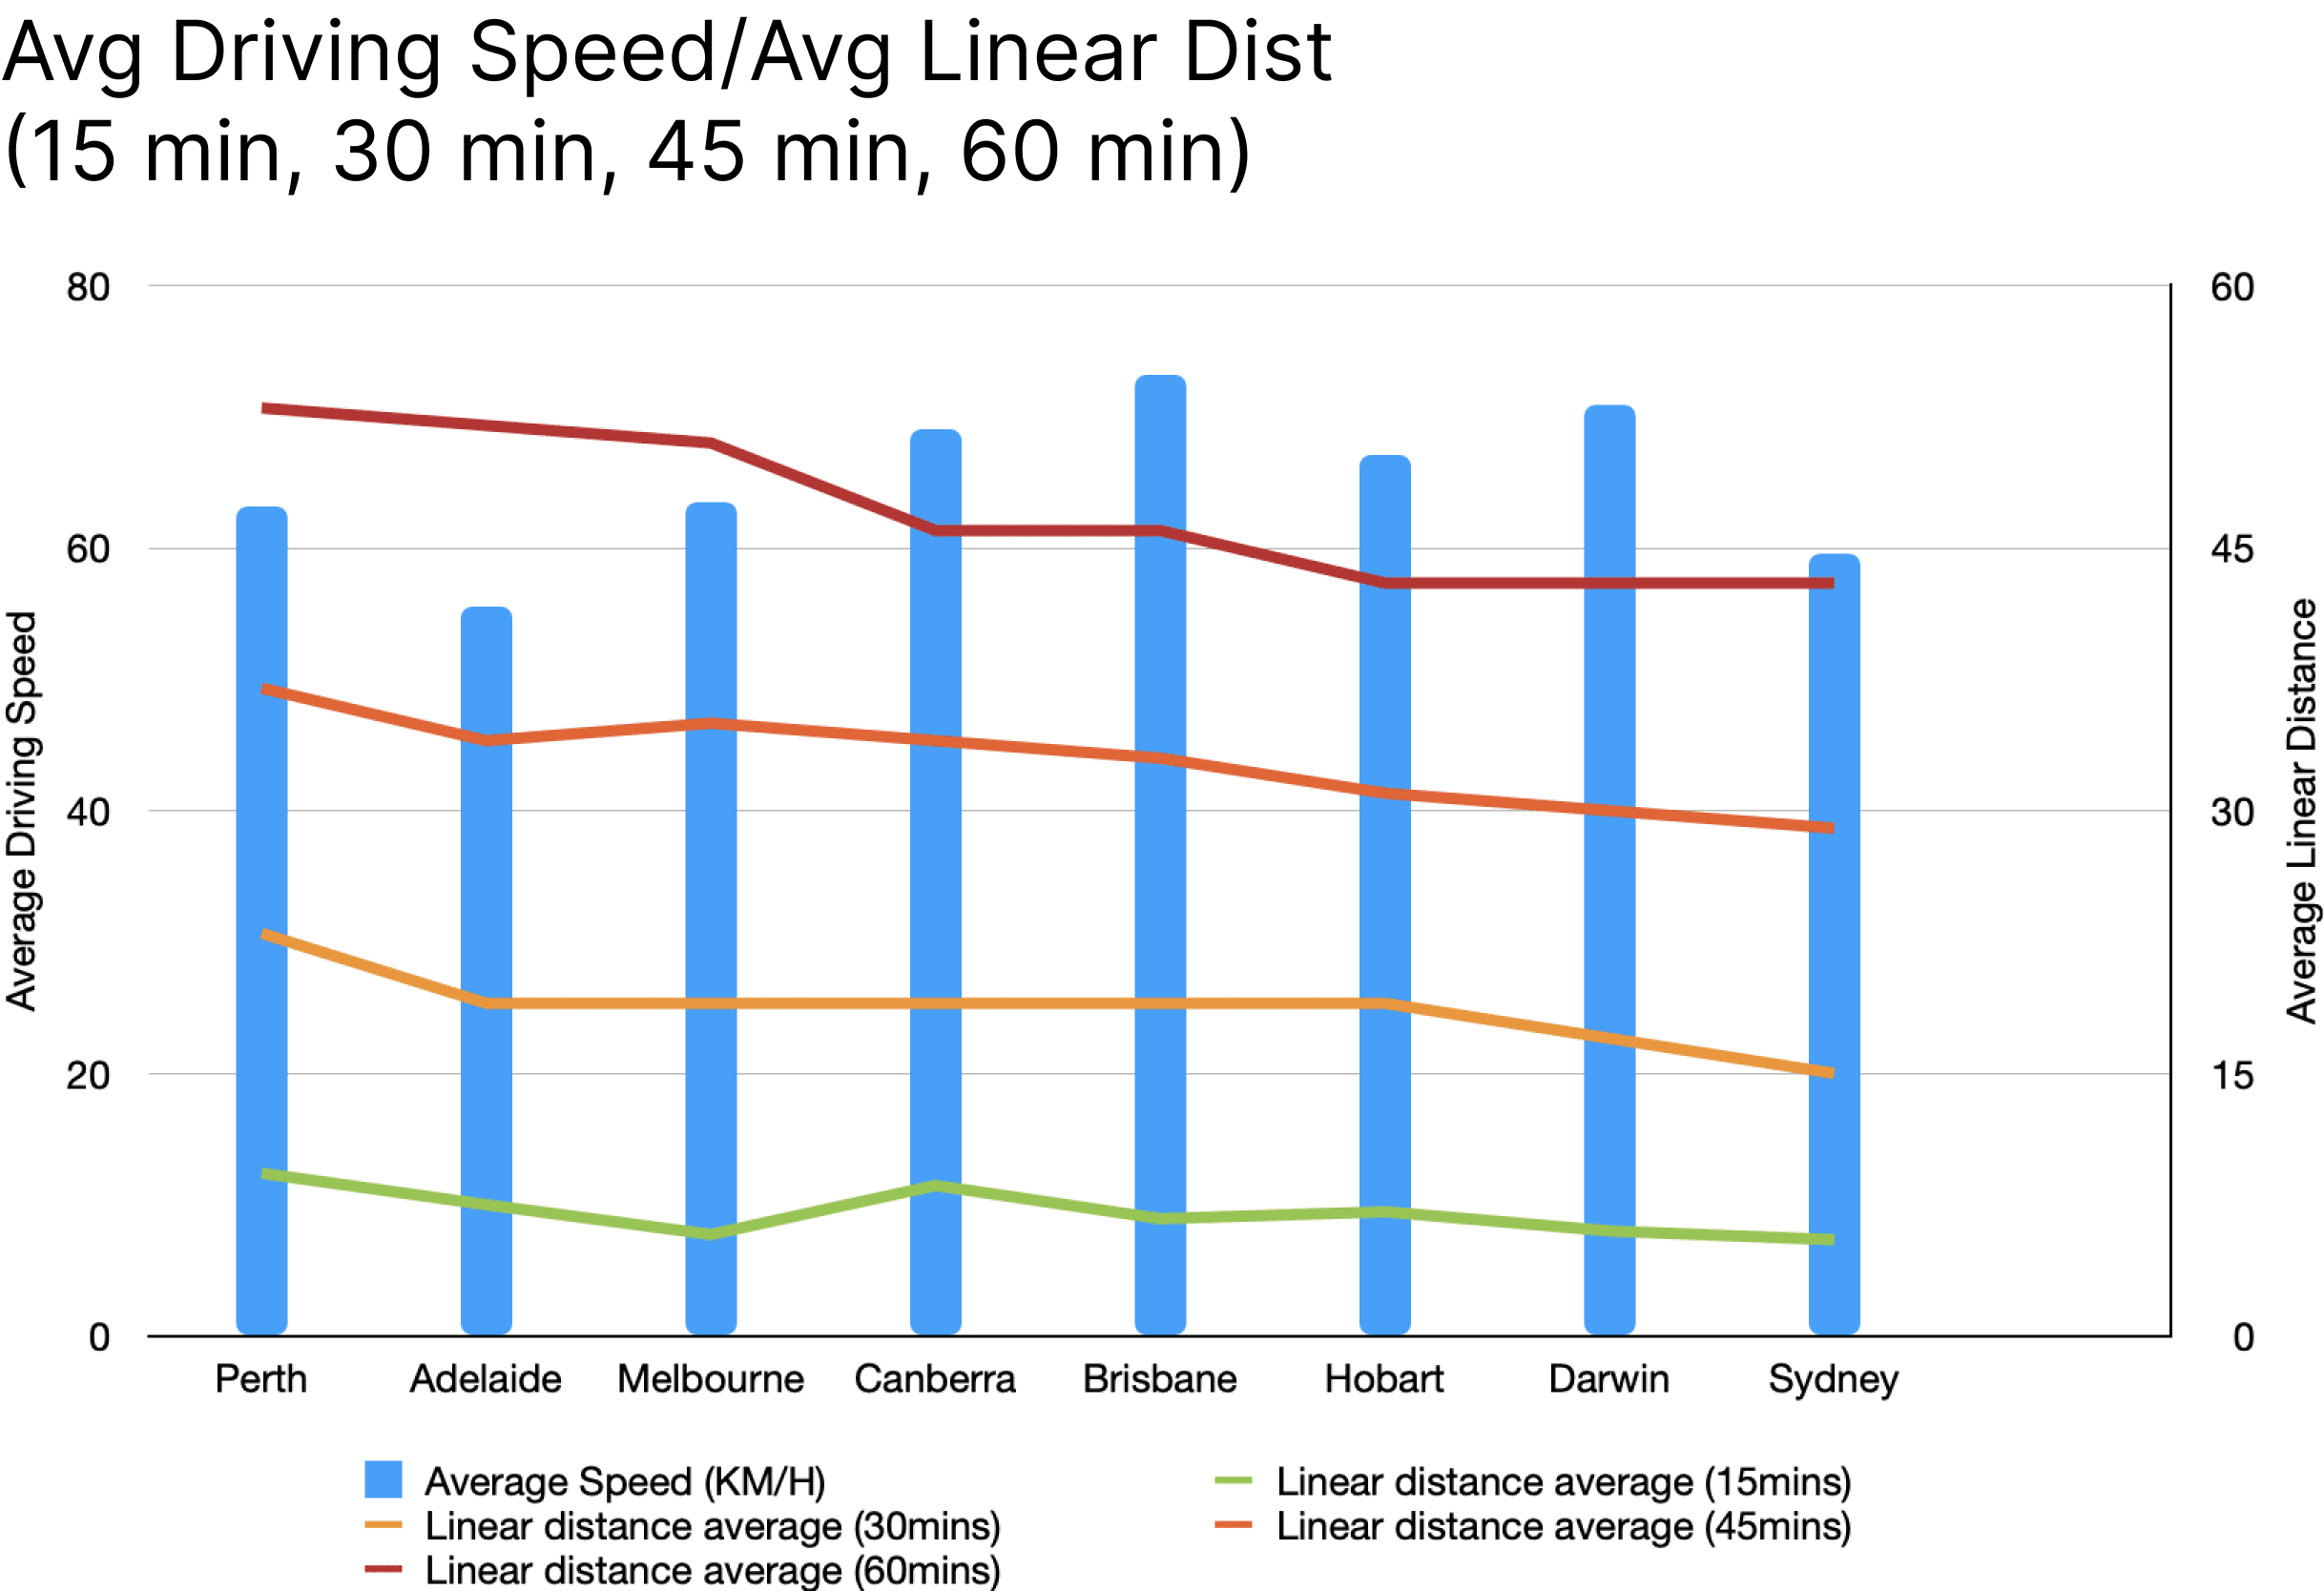
Unsurprisingly, a city’s population size directly ties into its traffic conditions. Urban hubs like Sydney and Melbourne, with populations exceeding 5 million, are often gridlocked, resulting in slower average speeds and shorter travel distances. Meanwhile, smaller cities such as Canberra and Hobart offer less traffic, leading to higher average speeds. A comprehensive picture of driving efficiency emerges when we overlay population data, average driving speeds, and linear distances.
 Source: Population - www.abs.gov.au
Source: Average speed - www.aaa.asn.au
Source: Population - www.abs.gov.au
Source: Average speed - www.aaa.asn.au
Pit Stop at Canberra’s Urban Plan
Canberra’s planned city layout and smaller population make it a unique case study. With the ease of travel within the 15 and 30-minute boundaries, you can zip across Canberra city within half an hour starting from the centre. Although it outshines Sydney and Melbourne in average distances covered within a 15-minute time frame, its overall performance and intermediate speed trail behind other cities, which boast significantly larger populations.
The Final Lap: Best and Worst Cities for Driving
Determining the best and worst cities to drive in is more complex than selecting the fastest drive time. It hinges on your unique needs as a driver – perhaps you prioritise swiftly covering large distances or value the ease of local navigation. It also depends on your location within the city and what amenities and destinations you need to access. However, for this discussion, we can shed light on which cities offer the smoothest and most challenging driving conditions using the data at hand.
-
Perth: Taking the pole position, Perth, Australia’s fourth-largest city, claims the title for the most favourable driving conditions. This status comes from its high potential travel distances across all time frames.
-
Adelaide: Adelaide fares well regarding proximity to the town in the 15-minute bracket and distance in the 60-minute frame. However, it struggles in the intermediate zone of 30-45 minutes.
-
Melbourne: Despite its large population, Melbourne surprisingly serves its residents well in the 45 to 60-minute bracket. However, it needs to catch up in the 15 to 30-minute range.
-
Canberra: Canberra is a noteworthy contender, offering efficient driving within shorter distances, between 15 to 30 minutes. However, given its planned layout and size, one might expect it to have performed better.
-
Brisbane: Brisbane lingers in the middle of the pack, providing a mix of driving experiences, making it a jack-of-all-trades.
-
Hobart: Hobart, with its small population and quick driving times, doesn’t significantly impact the linear distance measure. Perhaps in cities of this size, residents are close enough to all necessary amenities, reducing the need for optimised connectedness.
-
Darwin: Darwin trails with Hobart, proving that speed does not equal distance. The city’s compact nature likely contributes to everyone’s ability to reach their destinations adequately.
-
Sydney: Lastly, to no Sydney residents surprise, Sydney presents the most challenging driving conditions.
Using Data Connected to the Lives of People to Make Better Decisions
By understanding the intricate interplay of geography, population, average speeds, and urban planning, we can influence city planning and infrastructure for the better. Recognising these factors can help us tackle transportation challenges and create a more connected and efficient urban environment. By merging data with real-world experiences, we can drive towards a future where our cities genuinely cater to all residents’ needs, forging a path towards more inclusive, efficient, and liveable cities. The more we understand the systems that govern our lives, the better we can shape them for the future.